Interesting debunking of blatant misrepresentation of Long Covid data from the UK national survey. None of this can be argued to be accidental, it's very deliberate manipulation of perception. It clearly aims to misrepresent the lie that most people who would go on to develop LC already have. We keep hearing how LC incidence is going down, despite data not backing it up. Well, when data doesn't back up a feeling, you can just misrepresent it with graphs.
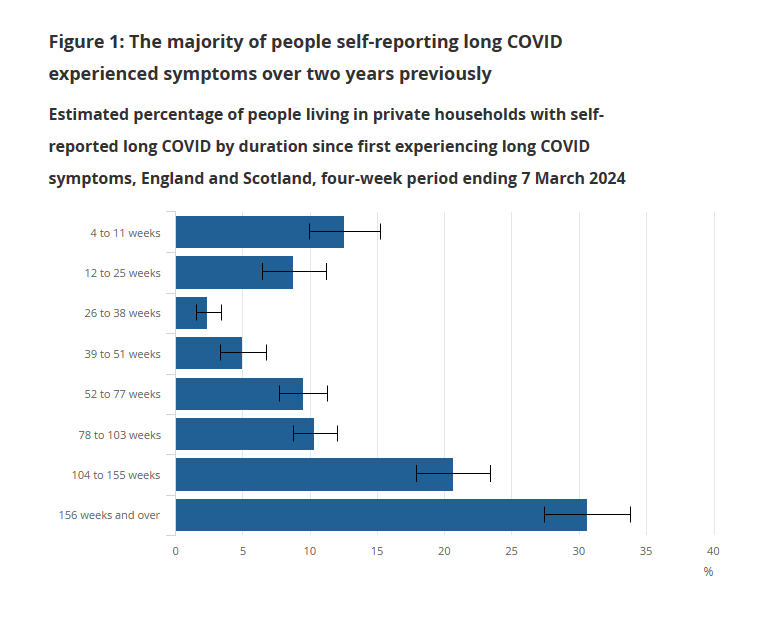
Here's how they presented the data:
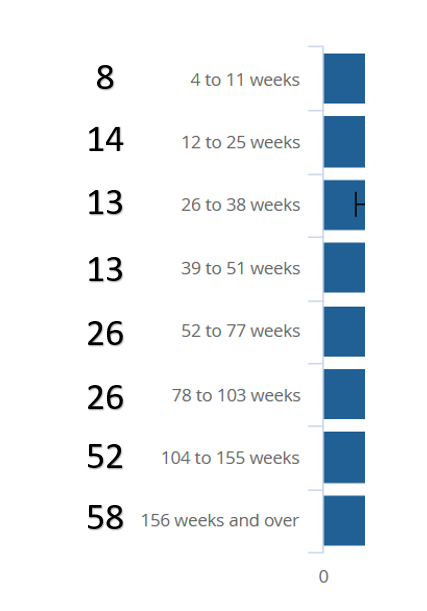
Using different time intervals:
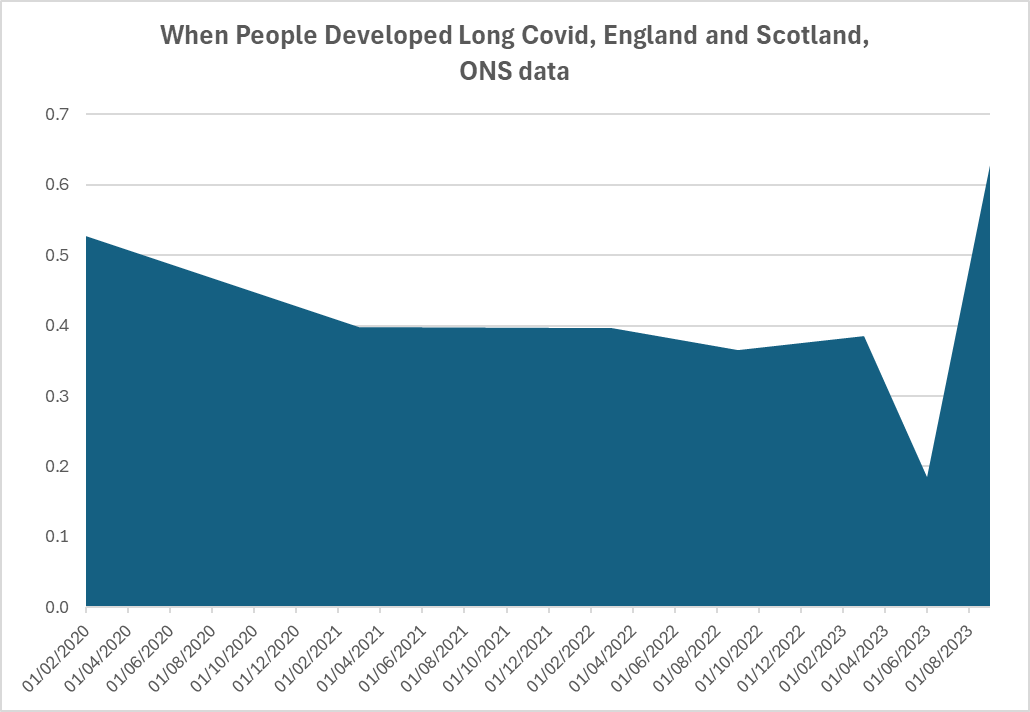
Here's what it would look like normalized over identical time spans:
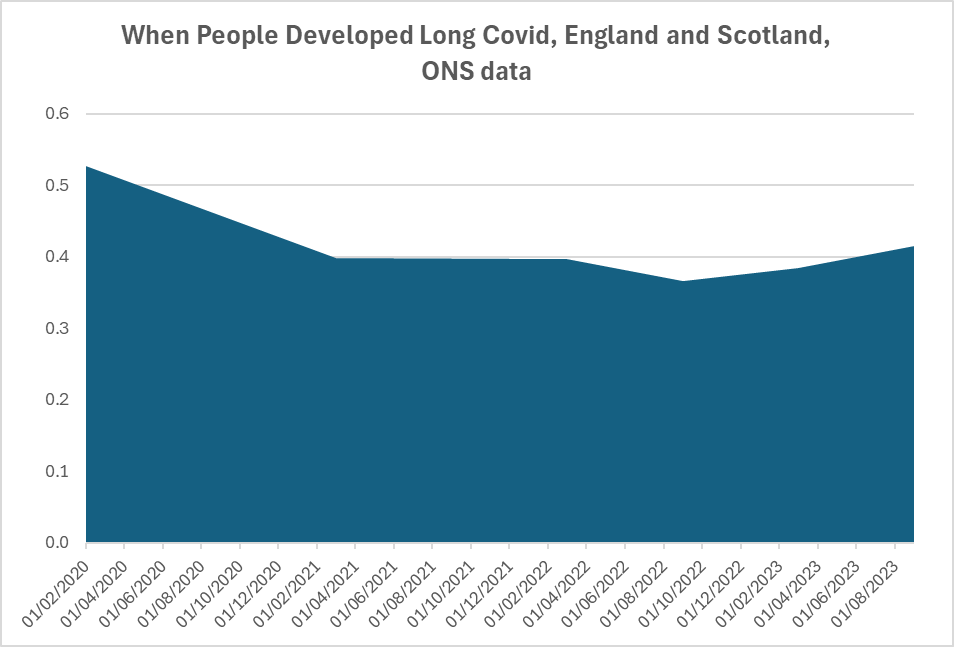
This is what using a 6-month average looks like, probably a better indicator to remove much of the short-term cases:
Fairly consistent across time. A masterclass in propaganda, how to lie using statistics. Technically, they are presenting the data as it is, but they are giving a blatantly false impression of it. This is more in line with recent population survey data from the US, and less recent data from Canada.
Incidence of LC is not going down. Public health authorities and influential MDs are saying so anyway, because they have a vested interest in the lie. This is going to destroy trust in public health and medicine. And if we hit even a middling case of H5N1 pandemic, years of "it's just the flu" are going to make everything worse.
So given this, how trustful should people be of medical data? When there is a clear all-out-in-the-open Big Lie happening about a major current event? In combination with giving alternative medicine pseudoscience prominence at the policy level, all the way down to the clinical interface, in part in response to having committed to a Big Lie?
So again, the crisis in medical academia is not about replicability, BS is easy to replicate, it's about validity, and the lie begins at the recording phase. And we're still going to see much puzzlement over the next few years from MDs who can't for the life of them understand why people don't trust medical professionals. Good grief.
The thread: