Kitty
Senior Member (Voting Rights)
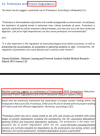
The protocol says that exclusion criteria are "(ii) any alternative diagnoses including major psychiatric illness (e.g. bipolar disorder or schizophrenia) that can result in chronic fatigue, as explicit in the Canadian Consensus and IOM/NAM criteria[4, 14]." so in my head that would include Hashimotos, Graves, Lupus, MS, Sjögrens etc. So quite a few B-cell autoimmune diseases that have HLA link if I'm not mistaking. If I remember correctly it wasn't possible to exclude such people in the control sample?
Assuming these conditions were excluded, it might not have been possible to screen them fully out of DecodeME either. For one thing, people have the HLA types involved without ever getting autoimmune disease. There could also be participants who both have them and are destined to develop an autoimmune condition, but they were included because they gave their DNA sample before signs of it became apparent.
I don't know whether people with autoimmune disease were excluded or not, though. I have one (psoriatic disease) which gets referred to as autoimmune and auto-inflammatory so interchangeably that I've no idea what either means any more, but I was allowed to give a sample.

