Am afraid this interpretation of the conditional plot on signal depth across the genome is not correct,
The basic idea of this plot is:
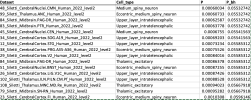
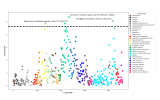
MAGMA is used to identify which cell types exhibit gene expression profiles which are significantly associated with MAGMA gene scores (which are based on GWAS significance of variants around each gene). Just regular MAGMA for this step.
Say we identify that eMSNs in the cortex, eMSNs in the cerebellum, and glutamatergic cells in the amygdala are all significant in the above analysis. There's a possibility that different tested cell types are very similar in gene expression, in which case one cell type might be MAGMA significant due to being important, and the others significant due to being very similar in gene expression to the important cell type.
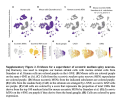
So the goal is to identify independent signals that don't rely on similarity of expression between cell types. The MAGMA regression is run, testing if gene expression in, for example, eMSNs in the cortex is associated with gene scores, while controlling for gene expression in eMSNs in the cerebellum. If this is no longer significant, we can say the signal in the former cell type is not independent of the signal in the latter cell type, and may be due to the similarity of the cell types.
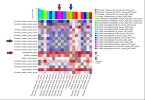
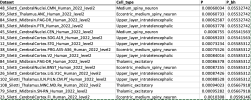
The plot is showing the result of each pairwise regression.
A red square indicates that the MAGMA p-value did not decrease much for a cell type, even after controlling for the other cell type, suggesting an independent signal. When a square is blue, or at the most extreme end, grey with a star, it means the p-value substantially decreases when controlling for the other, suggesting that there may be a shared signal responsible for both cell types being significant.
We see red squares when testing glutamatergic neurons controlled for eMSNs, suggesting that these are independent signals. We see blue squares when testing glutamatergic neurons controlled for other glutamatergic neurons, suggesting they are very similar and thus one might be significant just because the other is.
Essentially, it's showing that eMSNs are significant, and this is not due to the similarity to glutamatergic neurons, and vice versa. Most of the different eMSN cell types, on the other hand, appear to not be independent from each other. It's kind of like two loci in a GWAS manhattan plot. The variants within a locus are not independent of each other (due to being correlated to each other), but the variants between loci are.
The procedure is described in
Watanabe 2019:
The last step is to unravel relationships between significantly associated cell types across datasets. Although the absolute gene expression values in different datasets are not directly comparable, cross-datasets (CD) conditional analysis allows us to test the extent to which the significant gene expression profiles found in different data sets reflect the same or similar association signals. The analysis is performed for all possible CD pairs of significant cell types retained from the second step (see “Methods” section for details). Then the PS [proportional significance] of the CD conditional P-value of a cell type relative to the CD marginal P-value is computed for each cell type of all possible pairs. In this step, the pair-wise conditional analysis provides an overview of independent clusters of signals associated with a trait.