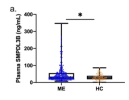
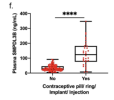
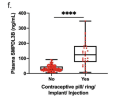
Figure 2. Influence of covariates on plasma SMPDL3B levels and symptom severity in ME patients. (a) Plasma levels of SMPDL3B in ME patients (n = 249) and healthy controls (n = 63) from the Canadian cohort. (b) Plasma levels of SMPDL3B in different groups of patients with ME from the Norwegian cohort grouped by symptom severity (n = 16 for mild, n = 40 for mild/moderate, n = 41 for moderate, n = 22 moderate/severe and n = 21 severe). Disease severity was determined based on clinical assessments incorporating standardized and trial-specific questionnaires. (c) Plasma SMPDL3B levels in ME Canadian, ME Norwegian and healthy control female participants (n = 208, n = 119 and n = 33 respectively) and males (n = 41, n = 22 and n = 30 respectively). (d) Plasma concentrations of SMPDL3B in Canadian female ME participants across different age groups (n = 16 for 18–30 years, n = 97 for 31–50 for years, n = 95 for 51 years and up). (e) Plasma concentrations of SMPDL3B in Norwegian female ME participants across different age groups (n = 37 for 18–30 years, n = 65 31–50 for years, n = 16 for 51 years and up). (f) Plasma levels of SMPDL3B in Canadian female participants with or without oral contraceptive use (n = 176 and n = 32 respectively). (g) Plasma levels of SMPDL3B in Norwegian female participants with or without oral contraceptive use (n = 88 and n = 31 respectively). An unpaired T test was performed when comparing two groups. For comparisons between two groups, the Mann–Whitney U test was used. For comparisons involving more than two groups, the Kruskal–Wallis test was performed, followed by Dunn’s post hoc test with multiple comparison correction where appropriate. Differences were found to be significant at *P < 0.05, **P < 0.01, *** P-value < 0.001 and ****P < 0.0001


