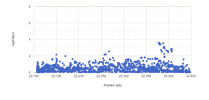
At least all the variants for the genes that replicated in the other cohort show "Pass".I took the first three variants in Table 1 (Top ranked genes) and all three have known quality issues noted on the Broad Institute gnomAD browser/database.
PTPRD
https://gnomad.broadinstitute.org/variant/9-8436361-A-G?dataset=gnomad_r2_1
https://gnomad.broadinstitute.org/variant/9-8318231-A-G?dataset=gnomad_r2_1
https://gnomad.broadinstitute.org/variant/9-8409888-C-G?dataset=gnomad_r2_1
https://gnomad.broadinstitute.org/variant/9-8845429-G-A?dataset=gnomad_r2_1
https://gnomad.broadinstitute.org/variant/9-8897215-C-T?dataset=gnomad_r2_1
https://gnomad.broadinstitute.org/variant/9-8901739-A-G?dataset=gnomad_r2_1
https://gnomad.broadinstitute.org/variant/9-9270379-G-T?dataset=gnomad_r2_1
https://gnomad.broadinstitute.org/variant/9-9829690-G-C?dataset=gnomad_r2_1
https://gnomad.broadinstitute.org/variant/9-9904274-G-A?dataset=gnomad_r2_1
https://gnomad.broadinstitute.org/variant/9-10254793-T-G?dataset=gnomad_r2_1
CSMD3
https://gnomad.broadinstitute.org/variant/8-113650725-C-T?dataset=gnomad_r2_1
https://gnomad.broadinstitute.org/variant/8-113617156-T-G?dataset=gnomad_r2_1
https://gnomad.broadinstitute.org/variant/8-114359441-G-T?dataset=gnomad_r2_1
https://gnomad.broadinstitute.org/variant/8-114399612-A-G?dataset=gnomad_r2_1
https://gnomad.broadinstitute.org/variant/8-114406336-G-A?dataset=gnomad_r2_1
https://gnomad.broadinstitute.org/variant/8-114418955-T-C?dataset=gnomad_r2_1
https://gnomad.broadinstitute.org/variant/8-114436474-T-G?dataset=gnomad_r2_1
RAPGEF5
https://gnomad.broadinstitute.org/variant/7-22184167-G-A?dataset=gnomad_r2_1
https://gnomad.broadinstitute.org/variant/7-22278040-A-T?dataset=gnomad_r2_1
DCC
https://gnomad.broadinstitute.org/variant/18-50924132-T-C?dataset=gnomad_r2_1
https://gnomad.broadinstitute.org/variant/18-50369520-G-C?dataset=gnomad_r2_1
https://gnomad.broadinstitute.org/variant/18-50567129-G-A?dataset=gnomad_r2_1
https://gnomad.broadinstitute.org/variant/18-50597529-T-A?dataset=gnomad_r2_1
https://gnomad.broadinstitute.org/variant/18-50618359-G-A?dataset=gnomad_r2_1
https://gnomad.broadinstitute.org/variant/18-50622857-T-G?dataset=gnomad_r2_1
https://gnomad.broadinstitute.org/variant/18-50622885-C-T?dataset=gnomad_r2_1
https://gnomad.broadinstitute.org/variant/18-50623189-G-A?dataset=gnomad_r2_1
https://gnomad.broadinstitute.org/variant/18-50668321-C-A?dataset=gnomad_r2_1
ALDH18A1
https://gnomad.broadinstitute.org/variant/10-97367511-C-A?dataset=gnomad_r2_1
https://gnomad.broadinstitute.org/variant/10-97392993-T-C?dataset=gnomad_r2_1
GALNT16
https://gnomad.broadinstitute.org/variant/14-69809143-G-A?dataset=gnomad_r2_1
https://gnomad.broadinstitute.org/variant/14-69734498-C-G?dataset=gnomad_r2_1
UNC79
https://gnomad.broadinstitute.org/variant/14-94120712-C-T?dataset=gnomad_r2_1
https://gnomad.broadinstitute.org/variant/14-93902973-A-G?dataset=gnomad_r2_1
NCOA3
https://gnomad.broadinstitute.org/variant/20-46270379-G-A?dataset=gnomad_r2_1
https://gnomad.broadinstitute.org/variant/20-46215501-G-A?dataset=gnomad_r2_1
Last edited:

