Andy's attempt to create a reasonable descriptive model of ME.

A few further thoughts.

A danger of this being seen as confirmation of the so called 'push-crash cycle' so many people with ME object to, and which hasn't been shown in evidence.

A danger of oversimplification ending up misleading rather than helping.

Is the person in your mild or moderate model taking sensible rest periods between activity, in order to prevent PEM, or is your model illustrating overactivity followed by PEM? I think those are two different things.
 
Ok, sorry. I might have misinterpreted. Your text, using the term SEL, was quite thought-provoking.

Perhaps moderators could duplicate the posts starting with Andy's text and post them on another thread that tries to work out descriptions of PEM?
No problems, again it's probably a sign that I didn't word things as clearly as I might have done.

For post duplication, it'll be easiest for the mods if you report the post that is the start of what you want and explain what you want.
 
For post duplication, it'll be easiest for the mods if you report the post that is the start of what you want and explain what you want.
Ok.

I was thinking of a thread that starts with post number 8 (your text) and includes the other posts until post 19 (which is where you suggest creating another thread). The title could be something like: "working out descriptions of PEM." Perhaps you, Andy could then indicate which posts you would like to keep on this discussion. Feel free to delete any of mine if you think they are derailing the discussion.

Thanks for your work on this.
 
This is a ll a very very good idea @Andy :) nice one

[Note: I have a graph for this but didn't feel it added anything.]
Actually I think it would be good to see, especially when held up against the other 2 (mild & moderate)

In other words, your graph for moderate looks more like my experience of 'mild'. I was never anywhere near your graph for mild.
yes I have to agree 'over exerting' to 75%... 75%?! golly I don't know anyone who's moderate who could exert to 75% of 'normal/healthy' even once, never mind 2 days in a row.

I think all the SLEs & over exertion points are significantly too high.
I realise this point feeds into some differences of opinion in terms of what constitutes 'mild/mod/severe' but again I never heard of anyone mild who went to work full time & then only reduced their activities down to 75% at the weekend & avoided PEM, from what I've read most mild people spend their wk ends flat out on the sofa or bed if they work full time. Perhaps i'm wrong about that. But it would seem that the graph would be more accurate with the milds reducing down to 60 or even 50% at the wk ends, & the moderate 'overexertion' point showing at 60%.

Again only my pov …. maybe others will disagree.

A further thought. It's not so much a case of 'in an attempt to avoid PEM they reduce their activity level...', more a case of the SEL drops after a short period of exertion, so they are forced by symptoms and lower energy ceiling to exert much less. In other words, it's much more complex - the SEL fluctuates too.

If you overexert, you don't just temporarily experience more symptoms that make life more difficult. Outsiders might misinterpret PEM this way. As Trish suggested during PEM, the SEL lowers as well. That means that you have to do much less to overexert yourself again. So in a sense, you are forced to reduce your activity level/energy expenditure, to make sure you don't keep making things worse. (theoretically, this could create a snowball effect, but I think symptoms quickly get so severe that patients are automatically forced to reduce their activity level so that this doesn't happen).

Yes.... very important that the SLE moves down commensurately after the over exertion. And as the SLE moves downwards the sensitivity to things like sensory input goes up.
iyam this is part of why this condition is so hard for non sufferers to grasp.
 
Then how do superficially very different triggers, such as physical exertion or sensory overload apparently trigger a similar biochemical response? Is it that they somehow indirectly act on the same underlying system?
To my completely non-medical but engineering oriented brain, the common factor is energy draw - they all require energy. Physical exertion may be the obvious one, but processing sensory inputs does not happen by magic, every form of processing has to consume energy, physical, cognitive, signal processing, whatever.
 
[Initial public draft]

This model is not an attempt to capture every symptom that all patients experience, but is an attempt to explain the patient experience of what many patients see as being the core issue of ME, Post Exertional Malaise (PEM). It is also NOT an attempt to accurately explain what is happening biologically, it is merely an attempt to set out a logical description of the patient experience.

*******
Introduction

ME patients have both a reduced sustainable exertion limit, and an abnormal reaction to overexertion, both levels of which are individual to the patient and may change over time.

Sustainable exertion limit (SEL) is the maximum level of exertion that a patient can reliably replicate without overexerting. This is no different to a healthy person, who too will have a sustainable exertion limit, only for an ME patient this limit is considerably reduced.

For many patients it is not impossible for them to exert themselves above their SEL, however the question then is, what is their individual tolerance to overexertion at the time that they overexert.

Too much overexertion, that exceeds the individual patient's tolerance to it, without sufficient rest to counteract it, results in PEM. The severity of PEM is often closely related to the severity of a patient’s condition, as the lower a patient’s SEL is, the more likely it is that overexertion will accumulate.

This suggests that the mechanism in the body that, in healthy people, leads to increased fitness is, in some way, broken in ME patients. This also could be related to Delayed Onset Muscles Soreness (DOMS) which seems to share some elements of PEM.

Overexertion and/or PEM may be the main reasons why a patient’s condition might deteriorate over time, however there are reports from patients of declines despite avoiding overexertion to the best of their abilities.


Descriptions and explanations of ME patients mildly, moderately and severely affected, within the context of this model.

For descriptive purposes, the SEL of an average healthy person is assigned the ‘score’ of 100, and the average basal metabolic rate is scored at 30.

Note - no attempt has been made to align the mild/moderate/severe categories used here with any other scale used elsewhere. Also, it is not the intention to suggest that the categories used are distinct phenotypes, they are used for descriptive purposes only.


“Mild” sufferers

This description likely represents the majority of the patients that medical professionals will see. While their SEL has been reduced, through overexertion they may still be able to maintain much of their previous lifestyle. Typically this may present as working a typical week, but using weekends as rest periods in which they dramatically reduce their activity.

The activity of a mildly affected suffer might be represented by the chart below, where the patient’s activity during the working week is at 95, and at the weekend 75.

sHt0IYfTVyoDQeadDmAxz6Cja7T2X9N-lihn5w0SIoRX5Kry-43fS6wB1lhcocFIT8nEuopolJhrRlYrc3YU8icgRhWC2jBFubH7GTv2fTwc6AHQoSii7a5lQ_clnrQuE5DoePlY


As long as the reduction in activity at the weekend is sufficient to counterbalance the overexertion during the week, this activity pattern might be long term sustainable.


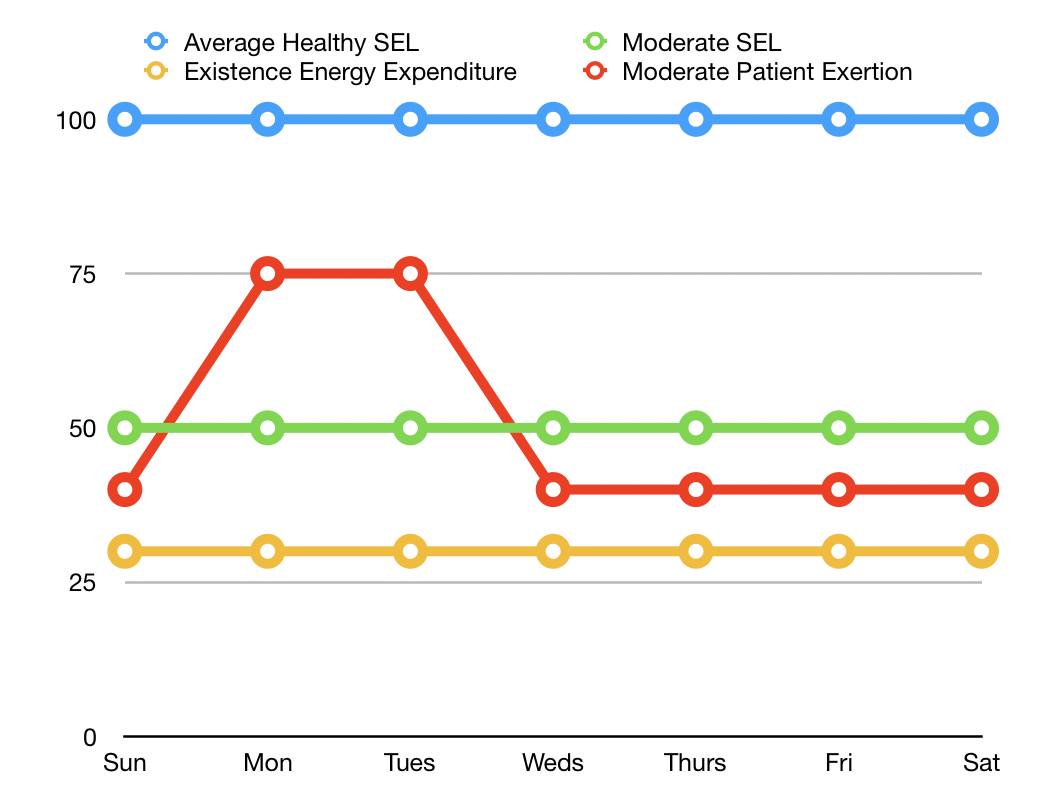
“Moderate” sufferers

This group will have made significant changes in their lives in order to maintain as much activity as is possible for them. They are unlikely to be working, almost certainly they won’t be working full time.

RDrHf3DG6Jqep4RGVyb79YJdoCCaHEKGO6DCcX2U-2mo_xPL06YJncSnohOgACmllaF4gDST5ksRuiAx2Sx05uu6pYoXGlXa3VMmbOkeBlp8r8KiStqb7XfUcpJye470uK_yAchn


Here the patient, whose SEL is 50, has two days in which they exert themselves to a level of 75. In an attempt to recover/avoid PEM, they reduce their activity to a level of 40. Again, this activity pattern might be sustainable but, as can be seen, the patient’s life is dramatically limited.


“Severe” sufferers

[Note: I have a graph for this but didn't feel it added anything.]

Severe patients could well find themselves in a situation where the SEL is below their basal metabolic rate (i.e less than a score of 30 in this model). If this is the case, it would mean that they are in constant PEM, with no way of escaping from it.


End thoughts
One quirk of the above might explain the concept of why and how mild and severe sufferers might be in constant PEM, whereas moderate sufferers might be able to manage their exertion enough to avoid PEM altogether.
[End]

Comments and improvement suggestions welcome.

ETA: "End thoughts" paragraph added.
Is PEM like DOMS? I'm not sure it is. One is the usual, expected soreness after exertion. Comparing the two might unintentionally mean lots of athletes think they have ME.
 
Is PEM like DOMS? I'm not sure it is. One is the usual, expected soreness after exertion. Comparing the two might unintentionally mean lots of athletes think they have ME.
Well, to start, I say
This also could be related to Delayed Onset Muscles Soreness (DOMS) which seems to share some elements of PEM.

So, for me, the elements that are shared are
1. delayed onset, both can occur hours or even days after exertion.
2. trigger, both are triggered by exertion.
3. some similar symptoms i.e. pain and soreness.

but I am not claiming that they are the same thing. You say that DOMS is the usual, expected soreness after exertion. Is it not reasonable to say that, for pwME, PEM is the usual, expected soreness, pain and exacerbation of other symptoms after exertion?

And as to swelling the ranks of pwME with "lots of athletes"? Sorry, I don't believe that this is a valid concern, given the additional criteria required for an ME diagnosis.
 
A danger of this being seen as confirmation of the so called 'push-crash cycle' so many people with ME object to, and which hasn't been shown in evidence.
In my proposed model, or in the graphs I've used, or the descriptions of patients?

A danger of oversimplification ending up misleading rather than helping.
Well, currently many researchers, even ones who we rate the work of, still state in their papers that the primary issue for ME patients is unexplained fatigue that has lasted 6 months or more, so I'd like to suggest that my model is not an oversimplification compared to that, and helps by refocusing onto SEL/PEM. It is not my intention to deny any other symptom that anybody has but I'm focusing on SEL/PEM as it seems to be the central issue for the vast majority of patients.

Is the person in your mild or moderate model taking sensible rest periods between activity, in order to prevent PEM, or is your model illustrating overactivity followed by PEM? I think those are two different things.
My intention with the descriptions of the patients with mild and moderate ME is to demonstrate potentially what an individual might be able to do, given the restrictions placed on them by ME.

For the mild person, I say
As long as the reduction in activity at the weekend is sufficient to counterbalance the overexertion during the week, this activity pattern might be long term sustainable.

and for the moderate person, I say
Here the patient, whose SEL is 50, has two days in which they exert themselves to a level of 75. In an attempt to recover/avoid PEM, they reduce their activity to a level of 40. Again, this activity pattern might be sustainable but, as can be seen, the patient’s life is dramatically limited.

Additional description can definitely be added, and perhaps even additional graphs, to illustrate what is sustainable for patients, which is what I have attempted to do already, and what isn't.
 
Well, to start, I say


So, for me, the elements that are shared are
1. delayed onset, both can occur hours or even days after exertion.
2. trigger, both are triggered by exertion.
3. some similar symptoms i.e. pain and soreness.

but I am not claiming that they are the same thing. You say that DOMS is the usual, expected soreness after exertion. Is it not reasonable to say that, for pwME, PEM is the usual, expected soreness, pain and exacerbation of other symptoms after exertion?

And as to swelling the ranks of pwME with "lots of athletes"? Sorry, I don't believe that this is a valid concern, given the additional criteria required for an ME diagnosis.
My point was more that this downplays what PEM is. Everyone can get DOMS. Not everyone gets PEM. There are already lots of tired people who say they think they have ME because they work shifts or whatever. If PEM was likened to DOMS, then I could see people who overtrain and have poor sleep patterns thinking they have ME.

If I were to compare the two, I'd say something like 'PEM is more than DOMS because...' and explain the differences, I think.

This is all my opinion, of course.
 
Struggling to get my brain around this thread, each time I try to form a comment my thoughts fall apart.

However, I do think this is important, that we have a strong language to delimit the patient experience and a clear formulation of the concepts we see as most important.

Thank you to all who are contributing.
 
Before I say anything else, I just want to say it's a really good idea. Any suggestions or criticisms I make are aimed at offering help with making it even better. I really like your starting point of SEL and the idea of using graphs. I just think they could do with some tweaking to make it even better.

A danger of this being seen as confirmation of the so called 'push-crash cycle' so many people with ME object to, and which hasn't been shown in evidence.
In my proposed model, or in the graphs I've used, or the descriptions of patients?
I meant the graphs, but I think this can be overcome with tweaks.
..............

If you are going to present this to scientists, I think you need to be extra careful not to including anything that is scientifically inaccurate. I have just checked my old friend Wikipedia on basal metabolic rates, and this is relevant I think:
About 70% of a human's total energy expenditure is due to the basal life processes taking place in the organs of the body (see table). About 20% of one's energy expenditure comes from physical activity and another 10% from thermogenesis, or digestion of food (postprandial thermogenesis).
https://en.wikipedia.org/wiki/Basal_metabolic_rate#BMR_estimation_formulas
This makes your assumed 30% figure unhelpful, and may lead them to discard the good parts of the model.
....................

How about setting basal metabolism (edit: and thermogenesis and digestion) at zero on your scale, so you can use the whole 100% for activity. And most definitions that I've seen say to be diagnosed as ME, activity is reduced by at least 50% I think.

Perhaps for each severity level, you could do two groups of graphs.
So for mild, with SEL set at 50%, you might show this:

1. Sustainable without PEM:
a) staying below the SEL. (steady on 40%)
b) exceeding the SEL a bit for a few days, and dropping below to recover for a few days after. (60% a few days then 20% a few days)
c) exceeding the SEL by more, but for much shorter time, and dropping below for recovery. (70% short part of one day, then 20% a few days).

2. Setting off PEM / crash.
a) a bit above SEL for too long, followed by a big drop into PEM lasting days or weeks. (60% for a week, dropping to 5% for a week or more)
b) a lot above SEL for a shorter time, followed by a big drop into PEM lasting days or weeks. (80% for part of a day, followed by 5% for a week or more)

Then you could repeat the same shape of graph but with the SEL set at different levels for each severity level.
For example 50% for mild, 25% for moderate, 10% for severe, and 0% for very severe.

Or this may not be what you want. Just a suggestion. Sorry I don't know how to produce graphs to show you what I mean.
 
Before I say anything else, I just want to say it's a really good idea. Any suggestions or criticisms I make are aimed at offering help with making it even better. I really like your starting point of SEL and the idea of using graphs. I just think they could do with some tweaking to make it even better.


I meant the graphs, but I think this can be overcome with tweaks.
..............

If you are going to present this to scientists, I think you need to be extra careful not to including anything that is scientifically inaccurate. I have just checked my old friend Wikipedia on basal metabolic rates, and this is relevant I think:

https://en.wikipedia.org/wiki/Basal_metabolic_rate#BMR_estimation_formulas
This makes your assumed 30% figure unhelpful, and may lead them to discard the good parts of the model.
....................

How about setting basal metabolism (edit: and thermogenesis and digestion) at zero on your scale, so you can use the whole 100% for activity. And most definitions that I've seen say to be diagnosed as ME, activity is reduced by at least 50% I think.

Perhaps for each severity level, you could do two groups of graphs.
So for mild, with SEL set at 50%, you might show this:

1. Sustainable without PEM:
a) staying below the SEL. (steady on 40%)
b) exceeding the SEL a bit for a few days, and dropping below to recover for a few days after. (60% a few days then 20% a few days)
c) exceeding the SEL by more, but for much shorter time, and dropping below for recovery. (70% short part of one day, then 20% a few days).

2. Setting off PEM / crash.
a) a bit above SEL for too long, followed by a big drop into PEM lasting days or weeks. (60% for a week, dropping to 5% for a week or more)
b) a lot above SEL for a shorter time, followed by a big drop into PEM lasting days or weeks. (80% for part of a day, followed by 5% for a week or more)

Then you could repeat the same shape of graph but with the SEL set at different levels for each severity level.
For example 50% for mild, 25% for moderate, 10% for severe, and 0% for very severe.

Or this may not be what you want. Just a suggestion. Sorry I don't know how to produce graphs to show you what I mean.
I too like SEL and want to add my own caveat. My suggestions are merely to help get this right. It's going to be hard to please everybody, though, because it will be difficult to describe PEM, or any of the symptoms really, in such a way as to include everyone all the time. That doesn't mean we shouldn't try, though.
 
Andy, without having read follow-up posts, I think you are off to a generally excellent start.

I do think that PEM should be defined when it is first mentioned (to help a general audience).

The one statement that was a clunker for me was: This suggests that the mechanism in the body that, in healthy people, leads to increased fitness is, in some way, broken in ME patients.

I understand what you are trying to say here, but the fact that increased activity and exercise generally makes a person in the healthy population feel better (both physically and mentally/emotionally) where exertion typically has the opposite effect in people with ME/CFS is a critical thing for people in the general population to understand. I think this point could be improved.

Quibble aside, good job!

Bill
 
About 70% of a human's total energy expenditure is due to the basal life processes taking place in the organs of the body (see table). About 20% of one's energy expenditure comes from physical activity and another 10% from thermogenesis, or digestion of food (postprandial thermogenesis).

I think Andy's proposal may not be too far off. The 70% figure is presumably typical of a normal lazy human. But Andy's SEL is,I think, the limit of what one can sustain. For Ranulph Fiennes in Antarctica this was 8000 calories a day. I suspect for an average adult it might be 4000-5000. I think the basal metabolic rate during sleep is about 60 Kcal/hr and the minimum during waking 90. That adds up to about 2000. Put another way a fit adult can use twice as much as their BMR and sustain it if they have to. Trebling it might be tough but my impression was that Andy was just choosing some illustrative figures. That would not worry me.

Hmm. Not at all sure about this.

If, by definition, pwME have to cut our normal activity by half, that suggests the SEL in ME is a long way below the healthy SEL, since 'normal activity' is well below SEL for most of us when we are healthy.

To use some crude figures, you are suggesting:
SEL for healthy adult males might be 5000 calories (3000 activity plus 2000 basal)
But the recommended daily intake for average males in the UK is 2500 calories (500 activity, 2000 basal).

The definition of ME requires having to drop to less than half of 'normal' activity', not half of SEL. So that would suggest, if your basal figure is right, dropping the ME SEL to 2250 calories.

That makes Andy's scale of ME SEL at 90% of healthy SEL way off the mark.

I think the best solution to this may be not to put any numbers on the vertical scale, and make it clear it's not a linear scale, it's the crossing the SEL line that is the key point, not absolute or relative figures. Andy says himself he wants to provide a 'descriptive model', not a scale model.
 
I think the best solution to this may be not to put any numbers on the vertical scale

I agree, but it was you that was grumbling about the numbers not being precise!

I don't think the recommended intake for average males comes in to the equation if the level in question is sustainable limit. I agree that for PWME sustainable limit would seem to be way below that of normal.

I guess this one reason why I find a metabolic explanation implausible. If a metabolic capacity is reduced by more than half it should have been reasonably easy to identify in physiological studies.
 
Sustainable Exertion Limit (SEL) - I like it!

The word exertion may need some definition though. Healthy people tend to interpret exertion as being the same as physical exercise such as jogging. Whereas we think of it more as any energy-demanding process (physical or cognitive activity, infection, sensory processing, etc.).

Thought experiment - an attempt at combining:
  • @Andy's model
  • the observation by several others in this thread that SEL is not fixed
  • the observation that sometimes some level of overexertion is temporarily possible
  • the observation that sometimes, after a major crash, our functioning is permanently reduced
I propose that there are THREE thresholds:

1) a SEL threshold - exceeding this does not cause PEM but it lowers all thresholds

2) a fully symptomatic PEM threshold (fsPEM), higher than SEL - exceeding this does cause PEM and lowers all thresholds

3) a critical point threshold (CP), higher than fsPEM - exceeding this does cause PEM and lowers all thresholds and permanently lowers 'baseline'

Example (the numbers are just for illustration, they don't correspond to any specific severity; the word recover in the example means recover to pre-PEM state, not to healthy):

Starting SEL=40 & fsPEM=60 & CP=90 ---> PwME exerts at 50. This doesn't cause PEM but it lowers SEL & fsPEM.

New SEL=33 & fsPEM=53 & CP=83 ---> PwME exerts at 50 again. This still doesn't cause PEM but it lowers SEL and PEM further.

New(2) SEL=26 & fsPEM=46 & CP=76 ---> PwME exerts at 50 again. This now causes PEM because it exceeds the new(2) fsPEM=46.

PwME's reaction to PEM, option 1:

PwME reduces exertion to 30, thinking that is safe because starting SEL was 40. But because 30 is higher than the current SEL (26) the PwME remains in PEM (for recovery from PEM exertion needs to be below SEL, not just below fsPEM). Thresholds lower further.
New SEL=19 & fsPEM=39 & CP=69 --> The downhill trend continues.

OR

PwME's reaction to PEM, option 2:

PwME reduces exertion to 20. This is lower than current SEL (26) so PwME begins to recover. Thresholds begin to rise again (but only after several days because PEM, once started, doesn't go away overnight).

Other scenarios:

Starting SEL=40 & fsPEM=60 & CP=90 ---> PwME exerts at 70. Leads to immediate PEM. Eventual recovery to Starting SEL=40.

OR

Starting SEL=40 & fsPEM=60 & CP=90 ---> PwME exerts at 100. Leads to immediate PEM. Eventual recovery only to Below Starting SEL=35.

Severity in this model could be varied by higher or lower starting thresholds as well as by the magnitude/speed by which thresholds go down after overexertion, or recover after rest.

NB: The graphic doesn't follow the above scenarios exactly but tries to combine the various options. A bit messy, I admit, but haven't got the energy to try again right now.
PEM graph.JPG
 
I don't think the recommended intake for average males comes in to the equation if the level in question is sustainable limit.
I disagree. My point was that an average healthy person has a SEL way above their actual activity level, so has loads of capacity for exceeding their normal level of activity without coming to harm. Whereas a person with ME, by dropping their activity capacity (the bit above the basal stuff) to half of a healthy person's normal activity level, leads to a massive drop in SEL, with the activity part becoming a very narrow range above basal, with very little leeway.

I wish I knew how to draw graphs so I could illustrate what I mean.
 
I guess this one reason why I find a metabolic explanation implausible. If a metabolic capacity is reduced by more than half it should have been reasonably easy to identify in physiological studies.

If most of the body's energy production goes toward merely sustaining itself, then even a small decrease in ability to produce energy would mean a large drop in ability to function in daily life.

If for example 70% goes toward sustaining itself, and 30% towards daily activities, then even a 10% drop in total energy production would mean that only 20% can go towards daily activities. 20% instead of 30% should be quite noticable for the patient. In a study however that 10% could look like an insignificant change.
Exactly. This is the notion that has been discussed in another thread recently, with analogy to "disposable income". When you have very little to spare you only need quite small changes in the absolute values to have a dramatic effect on the margin left over - potentially going negative.
 
Back
Top Bottom