|
|
We asked friends, members of various support groups and members of various online ME forums to complete a Chalder-style questionnaire, so that we would have a sensible idea of the variety of answers and of any difficulties that arise from it. Obviously this is not a proper scientific survey: there was no proper check on whether the respondents had ME according to various criteria, although, truth be told, most of them were known to us directly or indirectly. The questions were not set out in exactly the same way as they were in the PACE trial, although the phrases used were correct.
We obtained 123 results. The information contained certainly gives a consistent idea of the variability of the nature of ME over a year, a factor which clearly has major importance to any study, but which is not usually considered. We have not, for example, considered whether this variation is seasonal - if so, that factor alone would have a major effect on the way that studies should be conducted. Anecdotally, winter is often the time for worse scores.
Our respondents are likely to have had ME for longer (on average) than the PACE groups. This may be why their overall average score (the mean) is a little better than the patients at the start of the PACE trial (26.6 as opposed to 28.2), but the difference is not great. The standard deviation, of 4.45 (compared with 3.78), indicates a slightly greater spread of results, but all but one of the respondents had scores that would have put them within the criteria for participating in the trial.
There are three main areas of interest here: the size and extent of the variations in scores from bad patches to good patches; the "clumping" distribution of today's scores at the bottom end; and the restrictions that respondents found in trying to answer the questions. The first, variation, has been covered in the previous page 6-deeper along with some relevant comments from respondents relating to those restrictions. Also the same data has also been used in the 6-more animation. The second, the clumping, has been covered in 3-Chalder, comparing scores with assessment of severity. On this page we will look a little more closely at the distribution of the data itself. The results and patterns within them are complex, and can be interpreted in a number of ways. If you would like to try out your own ideas, the data may be downloaded in Excel format here .
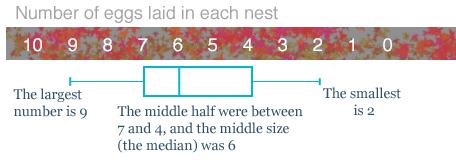
We are going to use boxplots to illustrate the results, so for those of you who are unfamiliar with that system, here is a fictional example of the number of eggs found in a survey of one species of birds' nests.
|
|
|
|
|
The rectangle shows where the middle half of the results could be - we can think of this as the typical results being between 4 and 7 eggs per nest (inclusive).
The vertical line in the rectangle shows the middle of the sample - the median - the average, 6 eggs.
You can also see that the full range went from 2 eggs to 9 eggs.
|
|
|
|
|
|
The purpose of a boxplot is so that you can see at a glance what the full range of results were (2 to 9), where the middle half were grouped (4 to 7), and what the middle value was (6 – otherwise known as the median). The mean (where you add and divide, which is a mean thing to ask someone to do if they haven't got a calculator) is often a poor choice of average, so we do not usually show it on a boxplot. (An average should give a good representative value. We covered this earlier in 2-details.)
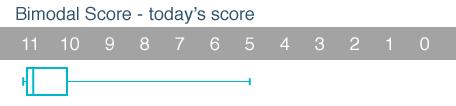
Here are the Bimodal Scores of the participants in our survey, where 11 is the maximum score and represents someone who is having problems with all of the areas covered in the Chalder questionnaire.
|
|
|
|
|
This shows "today's" scores, where 56% of the sample scored 11 points.
24% of the sample scored 9 or less.
The mean was 10·02 and the standard deviation 1·45. Clearly it would be wrong to use the mean as an average when more patients scored 11 than anything else.
|
|
|
|
|
|
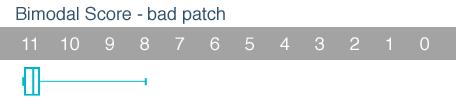
This shows the scores on a bad patch, where 76% of the sample scored 11 points.
11% of the sample scored 9 or better (i.e. less).
With so many clumped at the end, it is clear that this scale is not suitable for measuring harm - they are like a crowd of people trapped at a locked fire exit, unable to go any further.
The mean was 10·63 and the standard deviation 0·74. Again it would be wrong to use the mean as an average.
|
|
|
|
|
|
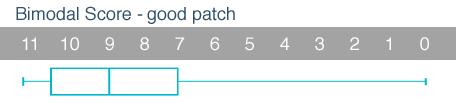
This shows the scores on a good patch, where 25% of the sample scored 11 points.
The mean was 8·33 and the standard deviation 2·46.
|
|
|
|
|
|
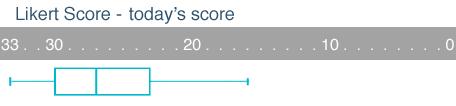
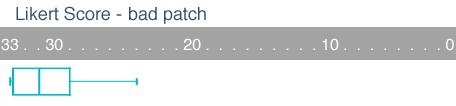
Here are the Likert Scores of the participants in our survey, where 33 is the maximum score, again signifying that the person is having very great difficulties in all areas of the questionnaire.
|
|
|
|
|
In our sample, for today's scores the median score was 27 and the mean score was 26.6: the distribution is moderately balanced, although there are 13 people clumped at the bottom end at 33 points, unable to register any worsening of their score.
|
|
|
|
|
|
On a bad patch, you can see how the survey group is closely bunched at the bottom. In fact there are now 44 people scoring 33 and unable to register anything worse.
It is likely that the data for the patients at the start of the PACE trial would have been between this and the previous boxplot of today's scores, again emphasising a clear clumping effect at the bottom of the scale, and restricting the ability of the scale to measure harm.
|
|
|
|
|
On a good patch the distribution has moved a long way from the bottom.
The distribution here is more balanced, with the mean (22.2) and the median (21) being quite close, and 60% of the sample being within the mean±standard deviation (i.e. 22.2±5.32).
|

|
|
|
|
|
We are confident that the initial boxplot for the patients in the PACE trial using either scoring system would have been between those for today's scores and the bad patch. This would mean that patients did not have much room to register any deterioration, but did have scope to register large improvement.
We have argued before that the median gives a better "average figure" than the mean, but we only have the mean values for the Chalder Fatigue Scale in the report. At the end of the PACE trial, the mean scores for the group that had only SMC, the CBT group, and the GET group were 23.8, 20.3, and 20.6, which is broadly in line with the scores on our survey in a good patch (22.2). It is important to recognise that any treatment that can move patients to a "good patch", even though very far from curative, is to be applauded, but our concern here is that the measure of spread, the standard deviation, is much greater in the PACE trial (6.6, 8.0 and 7.5) compared with the survey (5.3). We need at least to see the boxplots for each of these groups to have a clearer idea of what is happening: it could well be the case that a few individuals who have made great improvements have exaggerated the difference between the results of the SMC group and those of the CBT and GET groups.
It is very clear that any treatment which enables patients to manage their illness more effectively, and to lessen the impact of bad patches would be worthwhile, and would generally register an improvement in scores over time. This could include specialist medical care (of the sort given in the PACE trial), counselling and membership of appropriate support groups. Measured against the background natural variations in our survey, the differences between the final scores of the SMC group and those of the CBT and GET groups are unimpressive. These results are in line with our view that the specific use of CBT and GET together with their inherent psychological assumptions about ME/CFS is inappropriate, but that any method that focuses on better management of the illness will, in general, produce worthwhile improvements, but not a return to "normal function".
|
|
|
|
|
summary more details further details survey
|
|
|
|
|
pdf version
|
|
|
|

|
|
|