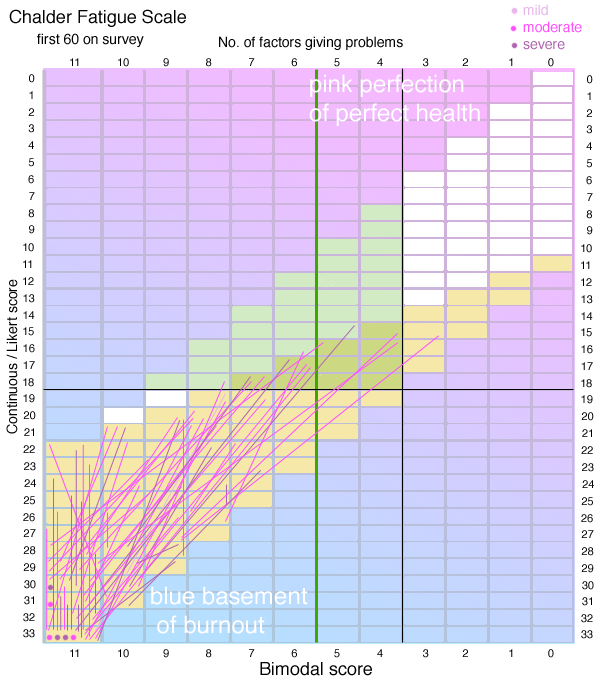
Longer lines clearly show greater changes. The further across a line goes indicates how many factors change from being a problem to not being a problem.
Out of the 60 results here, 45 of them have a bimodal score of 11 on a bad patch; 20 of them stay there on a good patch.
Looking at the general pattern of the lines, two things seem to be clear. One is that, for approximately half of these individuals, changes in Likert scores are matched with changes in Bimodal scores (these are the diagonal lines), so either scoring system for them registers their improvements. But for many of those at the worse end of the scale, with bimodal scores of 11, if they improve at all, they stay at a Bimodal score of 11 or 10. On average, lines go up 4 Likert points for every Bimodal point across.
The conclusion to draw from this is that there is a deep well at the bottom of the scale that fails to reflect the severity of the illness, and it is difficult for patients at this level of illness to register changes. Adding to that is the fact that many lines end at 11/33, suggesting that the scale is does not go low enough. In fact most lines stop at the bottom of a column. This adds doubt as to whether the scale is able to measure deterioration fully, which in turn could relate to the debate on whether the use of this scale in the PACE trial is sensitive enough to record harm.
Several people commented on this when returning the questionnaire. Here are two examples:
I think grading the questions is hard too as, compared with when I was well I am very bad indeed as on my best days I still can’t sit up in a wheelchair for longer than a couple of mins, but you automatically try to think of grades and put some as less bad simply because you are even worse in bad patches!
If I was to be completely honest, compared to pre illness, I would have to score each item as 'much more than normal' but this didn't allow any latitude to record the exacerbation of symptoms during a crash.
|