item2
rockingtitle2
topbar
lowerbar


The two methods of scoring the Chalder Fatigue Scale have very different properties. With the Bimodal system, people simply are listing the number of items that give them difficulties compared with when they were healthy. Obviously the 11 items listed in the Chalder questionnaire are not necessarily equal in importance, but a score of, say, 5 clearly states that 5 items are causing difficulties. It is more difficult to interpret the Likert score, where, say, a score of 23 could mean that a person has difficulties with somewhere between 6 and 11 items, depending upon how they score each item for severity.


Here is a smaller copy of a previous diagram linking Bimodal scores to Likert scores.

Click on each of the buttons below to see the results of our survey, and watch the pattern change as you move from one to another.


bLbad

These are the values for the 123 people in a bad patch.

These are the "today" values.

These are the values for them in a good patch.


Notice how, going from a bad patch to today's scores the results tend to lift upwards, then moving from today's scores to a good patch they spread both upwards and across.

(Full information of the results of the survey is on the next page.)

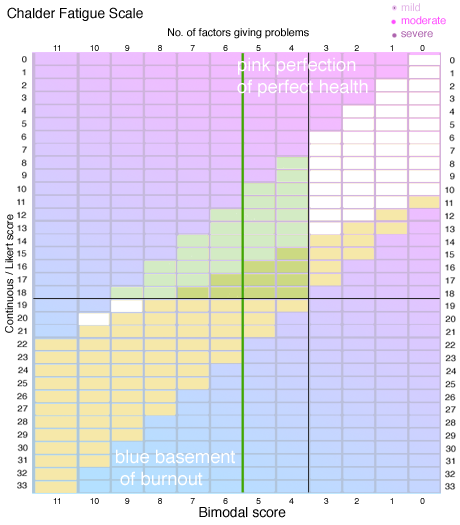
From a bad patch then, generally, the Likert scores are the first to react to any improvement. Then, once the overall score has been improved, the changes occur both up the Likert scale and across the Bimodal scale (although you will also see that there are many in the second phase still trying to move up out of the depths of the pit in the bottom left corner). This is very difficult to explain in words, because the relationship between the two scoring methods is not simple.

Using the medians as averages, we can say that the Likert score needs to improve by 8 points before the Bimodal score starts to change by 1 or 2 points: an improvement of 10 on the Likert matches a move of 3 across on the Bimodal score, 12 up for an improvement of 4 across and 15 up for an improvement of 5 across.

continbimodalpassing
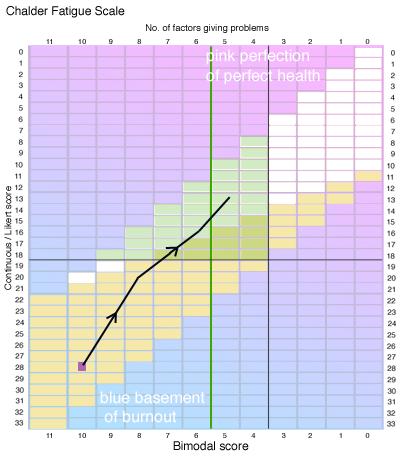
Here is a specific example of what that means. If a person is towards the bottom left corner at 10/28 (shown as a purple square), then the black line represents the average improvement pattern (although of course, only a few improve by as much as this). To satisfy the original criterion in the protocol document, that person would have to halve the bimodal score to 5, which is where the black line ends.

But you can also see that long before then, the person would cross the horizontal line at 18, which was the final criterion used by PACE to measure a "return to normal function": clearly a much easier target. Not only that, but the person would still be to the left of the green line and still be ill enough to qualify for inclusion into the PACE trial all over again.

In fact this situation (where it is much easier to satisfy the final target of 18 than the original requirement of halving the bimodal score) would be true for every position on the grid for patients. (However, we have too little data in from our survey to make a fair comment regarding movement from the bottom two places in the Bimodal 11 column.)   


The scores for the patients in the PACE trial at the start were approximately halfway between our survey's results on a bad patch and "today's scores". This could be expected since many of the patients would not yet have had much help with managing their illness.

It is clear to us that using the Likert scoring system with the Chalder Fatigue Scale has many more complexities than its general use with ME/CFS patients would suggest.


One problem with using this Likert scoring system for patients with ME/CFS is simply that the scale does not go far enough, so cannot measure the full range of severity. This leads to clumping of the data, and a lack of ability for those people scoring 3 in any given aspect to register any deterioration there: or, if that aspect is particularly severely affected, it would take a very great improvement for it to change to a score of 2. Restricting potential responses like this is a classic way to lose information.


How many miles did you travel to work today?
(a) none
(b) less than 1
(c) more than 1


Another is that it just doesn't seem to act like a simple scale
measuring the severity of ME/CFS in the same way that a speedometer measures speed. A score of, say, 26 can come from a wide variety of circumstances, and can represent a patient who is rated mild, moderate, or even severe. A change of, say, 10 Likert points can represent someone who has problems with all 11 items and continues to do so (number 41 in the survey) or someone who has nearly halved the number of items giving problems (number 16 in the survey), almost reaching the protocol target criterion. (You can download the survey data from the survey page).

We believe that much of this hinges on the undefined use of the terms more than usual and much more than usual in rating the severity of a symptom, phrases which many of our participants found difficult to interpret in the context of the variations of their illness. Take the simple question of "Do you lack energy?". If a very fit person found that she or he were only able to walk at a slow pace for up to half-an-hour, that could very correctly be rated as being much more of a problem than usual, but to someone bed-bound, being able to walk for up to half-an-hour would be an amazing improvement, so the perspective of what constituted much more as opposed to more would be very different.

This use of the scale in ME/CFS has too many problems for its use to be continued without a much more rigorous study of its reliability and consistency. It does not give us any clear assessment of the severity of the illness, nor of improvement.


summary          more         details          further details          survey


pdf version  


bottombarBig1

item1a > 6. We need better contact/comments > Home < Return to Summary survey details more