item2
rockingtitle2
topbar
middlebar
lowerbar


In 2007/2008 what would you guess the average income was for people in the UK - £18500 or £26800?

Obviously you are looking for the catch now, but what exactly do we mean by average? Most of us, when asked to find an average of eleven numbers, say 3, 3, 4, 5, 7, 8, 8, 8, 9, 9, and 10, would add them all together then divide by 11, in this case to get 6·7.

The term average simply means a representative value: we have several different ways of defining an average in maths, and this method is properly known as the arithmetic mean.

There is another calculation to get a measure of the spread of the marks which is called the standard deviation (in this case it is 2·5), and is usually added and subtracted from the mean to give a spread of values which would contain approximately the middle two-thirds of a larger, well-balanced set of data (in this example it is 4·2 to 9·2).


You can see that the mean and standard deviation give a lop-sided look to our example of 11 numbers (click the mean button on the right).

Another method of finding an average is to find the middle value (the median) and to use that. Then the middle value of each of the two separate halves become known as the quartiles (the quarter-way marks). Here this would give 8 as the median, and the marks 4 and 9 would be the quartiles. This would mean that half of the marks would lie between 4 and 9 (click the median button on the right). For a small sample like this we do not nit-pick the fact that you cannot have half of eleven results.

The advantage of this method is that it genuinely gives you a central figure that is not distorted by excessive amounts, but of course it doesn't actually use all of the figures (which would be important, say, in looking at scores in sports).

Obviously, this is not a worthwhile exercise for such a small set of numbers - it is simpler just to look at the actual data.

In the UK in 2007/2008 the arithmetic mean income was £26800 whereas the median income - the income of the middle person - was £18500.


meanmediannumbers

bluemeanbutton

meansd

bluemedianbutton

medianquartiles


Unless you watched the programme on incomes by Jon and Dan Snow in 2008, you are probably surprised at how low the median income is. When a distribution is evenly balanced, both the median and mean work out at the same value, but when a distribution is skewed the more extreme values have a disproportionate effect on the mean, and even more so on the standard deviation. The lower and upper quartiles for income 2007/2008 are £11800 and £29500, which shows that probably a little under 70% of the country had an income below the arithmetic mean of £26800, which had been boosted by a relatively small number of people with very large incomes. The standard deviation is even more strongly affected, and works out at around £29500 which is certainly not a useful figure. The slides below show a graph of the incomes, and the two measures of average and spread.

salaryspread01

Click on each of the buttons beside each description to see the appropriate graph:-

   The median income

   The middle half of earners

   Showing the quartiles as a horizontal bar

   The mean income

   The standard deviation either side of the mean as a horizontal bar

   The proportion of the graph included within the mean ± standard deviation

   Both averages and spreads compared

   Return to the original graph


The reason why the arithmetic mean and standard deviation are so prevalent in statistics is that, being the result of a mathematical calculation, further calculations, such as significance, can be performed using them. But if the distribution concerned is heavily skewed, they are not good indicators of typical values.

There is an instinctive belief that the arithmetic mean is somehow "more accurate" because it is the result of a calculation and can be quoted to a number of decimal places. The term "accurate" is misleading though: we are looking for something that is truly representative, and that means a value judgement has to be made. If a distribution is balanced, the mean and median are close to each other, and either are appropriate. If not, then the median gives you a better idea of a typical value, whereas the mean would be appropriate when it would be wrong to exclude rarer high or low scores (e.g. working out a sporting average).The same is true of using the quartiles or the standard deviation as a measure of spread. In general, the median and quartiles for a general description, and the mean and standard deviation are best reserved for use where further calculations are necessary.

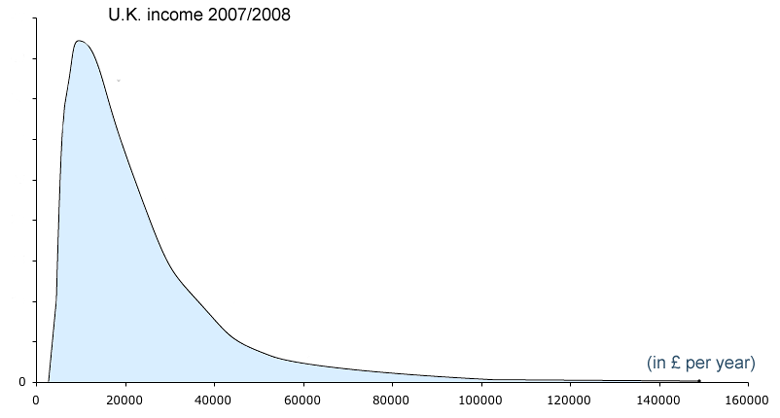
Why is all of this relevant to our discussion? Simply because much of the data in the PACE trial, and in other studies of ME/CFS, is skewed, so great care must be taken to ensure that values quoted are truly representational and not deceptively large.

When the Chalder Fatigue Scale was used for people with ME/CFS in the PACE trial, the scores were heavily weighted towards the bottom/very fatigued end, and so are heavily skewed. There are several ways to measure how skewed a distribution is; in fact the Chalder Scale turns out to be as skewed as the income distribution above. Using the mean and standard deviation to describe those results could not be described as giving a good indication of typical results. The use of medians and quartiles (or even key percentiles as the Office of National Statistics does) would have given a much more realistic idea. It is likely that the distribution of improvements in each of the other measures used in the PACE trial is similarly skewed: just as very high earners boosted the mean income, a smaller proportion of patients who showed great improvement would have had a disproportionate effect and would have boosted each mean score.

For a fuller explanation of the relevance to measures of fatigue and physical functioning in patients with ME, and an explanation of how the use of the standard deviation is deceptive, please click on the further details link below.


summary          more          details          further details          further faults


pdf version  


bottombarBig1

item1a contact/comments > Home < Return to Summary > 2. Future studies should further faults further details more