|
|
Understanding how standard deviation works is often essential when assessing many medical studies. The authors of the PACE study, for example, decided to set the boundary for "normal scores" at 18 or less on the Chalder Fatigue Scale, by adding the standard deviation of 4·6 to the mean of 14·2 calculated from a sample of patients attending doctors' surgeries. This, quite simply, is wrong.
The explanation is fairly straightforward, and easily understood, but does need to start with a simple example. Click each of the instructions below to step through the stages in calculating the standard deviation.
|
|
|
|
|
When we work out each deviation from the mean, we get a mixture of positive and negative numbers. Adding them together should always give zero – that's why the mean is the "balancing point". We square each number so that these values would always be positive: but look what happens to the last value – its importance goes up from 9 to 81 while all the other results stay the same. Suddenly this extreme value has become much more important.
Next, the total of the squares of these deviations is, surprisingly, divided by 9 rather than 10. One way to think of that is that we are dealing with differences. The ten original data values are like fence posts, and the differences are the panels between them. Although we have ten posts, we only have nine panels. Strictly speaking, we only have nine independent differences between ten items of data.
Then we find the square root, to "undo" the squaring: but of course, the damage has already been done - the extreme value has had an undue influence on the total.
|
|
|
|
|
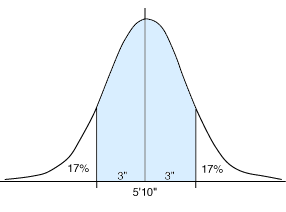
With a Normal (Gaussian) Distribution, like the one on the right for the heights of adult males, there are not many extreme values, and we are familiar with the distribution, so if we add and subtract the standard deviation of 3" to the mean height of 5'10", we can estimate that two-thirds of the population lie between 5'7" and 6'1".
This idea of mean±std.dev. is often used to define what we would call normal, or everyday measurements. But it only really applies to Gaussian Distributions. If the distribution is of an unusual shape, we are unable to judge what this calculation would give us.
|
|
|
|
|
|
|
In the example of incomes (on the previous page), the mean was £26,800 and the standard deviation was around £29,500 (this is a calculated estimate, and, if anything, is too small: we used a ceiling income of £330,000 in the calculation). If we add and subtract the s.d. from the mean, we get an income range of -£2,700 (a negative amount, meaning that the employee pays £2,700 for the privilege of working) to £56,300. This could hardly be used to represent the range of everyday incomes, as it covers around 93% of all incomes. The distribution is, of course, heavily skewed, with a very small number of people having very large incomes.
The "finger" example on the "more" page (where the average of 10, 10, 10, 10, 10, 10, 10, 10, 10, and 0 is 9) is a rather silly one, but instead think of it as being the set of class marks in a statistics test. What would you report to the parents as a normal mark out of 10 in the class - would you ignore the mark of zero and say 10, or would you use the mean and standard deviation and say between 6 (9–3·2) and 12 (9+3·2) out of 10 was normal? This is, in fact, a major problem in education when it comes to setting pass marks at examinations. In the 1970s only 20% of each year's UK intake were allowed to gain a pass at O-level Mathematics, whereas 40% were allowed to gain a pass at O-level English (which is why we have so many people who think they are so much worse at Maths than English). Since the inception of CSE and then Key Stage tests, examiners have moved away from these percentages to setting certain expected standards for each grade, and these are decided by experienced examiners and teachers. It is a very difficult task, but there is no way that they would use means and standard deviations to define levels, as these are so easily manipulated by the entry of additional weak candidates. If several schools suddenly entered significant numbers of poor students, it would become much easier to pass.
This is exactly what has happened with the target pass mark of 18 points set on the Chalder Fatigue Scale. To determine that, they used data from Pawlikowska and from Cella, which included a disproportionate number of ill patients, to calculate the mean and standard deviation (14 and 4), which they added to produce the boundary of 18 points (in this example, large scores mean lots of fatigue). Examiners, who have been determining standards for many years, would be aghast at this - it would mean that the ill patients, like weak students, would have a strong influence in lowering standards. The only professional way to determine this is to examine the scale, completed by many different people in various stages of good health and illness, and decide where the actual boundary is. This may well be what the authors did at the start of the study where, using a different scoring system for the scale (more of that in the next section), they set the targets at halving the fatigue score. They also added a spurious alternative – halving the fatigue score or scoring 3 or less (anyone scoring 3 or less would have halved their score). Whatever method they used to determine the boundary, it is very clear that the final target in the study was much easier to attain than the target in the agreed protocol.
Surely doctors and specialists have enough skill to able to agree amongst themselves, just as teachers and examiners do, about where the borderlines should be drawn, rather than simply use inappropriate calculations? Good health is a decision about quality: it is not a statistical calculation.
|
|
|