Preprint Initial findings from the DecodeME genome-wide association study of myalgic encephalomyelitis/chronic fatigue syndrome, 2025, DecodeMe Collaboration

As mentioned in the DecodeME paper OLFM4 is also a clear hit in GWAS on depression. Here's what their Manhatten plot looks like. That big peak on Chromosome 13 is the OLFM4 region. The effect size is quite small though, an odds ratio around 1.04.

1756221138240.png
Genome-wide association analyses identify 44 risk variants and refine the genetic architecture of major depression | Nature Genetics

Subsequent attempts to match these SNPs with gene expression data, however, largely failed. They found that OLFM4 expression looks different than the SNPs found in this region for depression. I think that could mean two things: either OLFM4 is just a bystander and the significant SNPs on that locus are pointing to a different gene or the eQTL is missing the signal (quite possible).

The eQTL with DecodeME data also did not turn out well for OLFM4 (hence why it is not a Tier 1 gene).

DecodeME also compared the signals for this locus on chromosome 13 for ME/CFS and depression and found that they do not match well. I wonder if this excludes that they both have the same effect. If so, then the statement about there being no link to depression genes in the preprint might be an overstatement.
1756221424261.png
 
In other GWAS I read that they compared their results to those of other conditions using LD Hub. Unfortunately that tool no longer seems to be available but perhaps BIGA GWAS might be an alternative?
BIGA provides different tools for quantifying cross-trait genetic architectures, such as genome-wide genetic correlation methods and local genetic correlation analysis.

To enable efficient data analysis, we have aggregated and preprocessed GWAS summary statistics from different sources (e.g., the UK Biobank, PGC, GWAS Catalog, FinnGen, Biobank Japan, BIG-KP, UKB-PPP, CHIMGEN, and UKB Oxford Brain Imaging Team) and provided curated datasets. Our framework can easily be extended to incorporate additional methods and GWAS summary statistics. We plan to update our databases to include new data recourses every six months.

The User can either upload your own data or directly query data from publicly available GWAS data resources (e.g., GWAS Catalog, IEU OpenGWAS project, and Neale lab), BIGA will harmonize user's input summary statistics data, which can also be downloaded after job is finished.
Bivariate Cross-trait Genetic Architecture Analyses of GWAS
 
Last edited:
In other GWAS I read that they compared their results to those of other conditions using LD Hub. Unfortunately that tool no longer seems to be available but perhaps BIGA GWAS might be an alternative?

Bivariate Cross-trait Genetic Architecture Analyses of GWAS
Awesome! I'm not yet positive I understand it right, but I've been trying to find if there's any tool to find the best correlations based on raw genetic data from thousands of other traits, and this might be it? And you don't even have to convert to grch37 or rsids.
 
negr1_2.png
The above was the 10th most significant locus in the main GWAS (though its p-value of 1.19e-7 didn't pass the genome-wide threshold). NEGR1 appears to be the closest gene. Lead variant: 1:73,126,414:C:CA

There appears to be evidence linking NEGR1 to depression. Link to PubMed search for "depression negr1". Here are some snippets from papers:

Identifying causal genes for depression via integration of the proteome and transcriptome from brain and blood, 2022, Molecular Psychiatry
we aimed to highlight potentially causal genes by systematically integrating the brain and blood protein and expression quantitative trait loci (QTL) data with a depression GWAS dataset [...] we identified [...] two genes (TMEM106B and NEGR1) based on blood data with consistent robust evidence at both the protein and transcriptional levels.

Bi-ancestral depression GWAS in the Million Veteran Program and meta-analysis in >1.2 million individuals highlight new therapeutic directions, 2021, Nature Neuroscience
Here we report results of a large meta-analysis of depression using data from the Million Veteran Program, 23andMe, UK Biobank and FinnGen, including individuals of European ancestry (n = 1,154,267; 340,591 cases) and African ancestry (n = 59,600; 25,843 cases). Transcriptome-wide association study analyses revealed significant associations with expression of NEGR1 in the hypothalamus

Depression in multiple sclerosis patients associated with risk variant near NEGR1, 2020, Multiple Sclerosis and Related Disorders
Known NEGR1 variant increases general depression risk in multiple sclerosis cohort.

Regulatory mechanisms of major depressive disorder risk variants, 2020, Molecular Psychiatry
we found that NEGR1 (regulated by the TF binding–disrupting MDD risk SNP rs3101339) was dysregulated in the brains of MDD cases compared with controls, implying that rs3101339 may confer MDD risk by affecting NEGR1 expression.

Integrating genome-wide association study and expression quantitative trait loci data identifies NEGR1 as a causal risk gene of major depression disorder, 2020, Journal of Affective Disorders
Through SMR integrative analysis, we identified the SNP rs10789336 located in Neuronal growth regulator 1 (NEGR1) gene significantly affected the expression level of RPL31P12 in brain tissues and contributed to the risk of MDD (P = 1.96 × 10⁻⁶). Consistently, the SNP rs10789336 was associated with the methylation levels of three nearby DNA methylation sites, including cg09256413 (NEGR1, P=1.72 × 10⁻¹⁰), cg11418303 (prostaglandin E receptor 3 [PTGER3], P = 4.78 × 10⁻⁶), and cg23032215 (ZRANB2 antisense RNA 2 [ZRANB2-AS2], P = 1.23 × 10⁻⁴). Differential expression analysis suggested that the NEGR1 gene was upregulated in prefrontal cortex (P = 5.14 × 10⁻³). Cognitive genetics analysis showed that the SNP rs10789336 was associated with cognitive performance (P = 2.41 × 10⁻¹⁶), educational attainment (P = 1.75 × 10⁻¹⁴), general cognitive function (P = 2.65 × 10⁻¹²), and verbal numerical reasoning (P = 1.36 × 10⁻¹²).

On function of NEGR1:

NEGR1 and FGFR2 cooperatively regulate cortical development and core behaviours related to autism disorders in mice, 2018, Brain
We found that downregulation of the cell adhesion molecule NEGR1 or the receptor tyrosine kinase fibroblast growth factor receptor 2 (FGFR2) similarly affects neuronal migration and spine density during mouse cortical development in vivo and results in impaired core behaviours related to autism spectrum disorders. Mechanistically, NEGR1 physically interacts with FGFR2 and modulates FGFR2-dependent extracellular signal-regulated kinase (ERK) and protein kinase B (AKT) signalling by decreasing FGFR2 degradation from the plasma membrane. Accordingly, FGFR2 overexpression rescues all defects due to Negr1 knockdown in vivo. Negr1 knockout mice present phenotypes similar to Negr1-downregulated animals. These data indicate that NEGR1 and FGFR2 cooperatively regulate cortical development and suggest a role for defective NEGR1-FGFR2 complex and convergent downstream ERK and AKT signalling in autism spectrum disorders.
 
So is that three genes related to autism spectrum disorder, even though the last one had a low p-value?

Makes my ears prick up, although of course it's possible autism-related genes turn up in GWAS studies for all kinds of things because they have other roles.
 
I've now run this tool on a few different datasets using LDSC to find genetic correlations between ME/CFS and other traits. I'll attach all results for download and just mention some specific correlations.

Wikipedia:
In multivariate quantitative genetics, a genetic correlation (denoted rg or ra) is the proportion of variance that two traits share due to genetic causes, the correlation between the genetic influences on a trait and the genetic influences on a different trait estimating the degree of pleiotropy or causal overlap. A genetic correlation of 0 implies that the genetic effects on one trait are independent of the other, while a correlation of 1 implies that all of the genetic influences on the two traits are identical.

First I ran it on the dataset "PGC (Psychiatric Genomics Consortium) and Other Brain Disorders" which includes 24 different phenotypes.

The highest correlation (rg=0.586, p=5.0e-121) is with depression (based on data from this paper). Second most significant was another depression study (though I'm not sure how much overlap there was in participants between the two). The third most significant (rg=0.3116, p=1.2e-28) was with schizophrenia. The fourth was bipolar II disorder (rg=0.5787, p=1.0e-22). Correlations with many other phenotypes in this dataset were significant as well.

(It was at this point I decided to search PubMed for "depression neurons" just to explore, and I saw a paper about NEGR1, which reminded me that I saw this gene in the locus above, which led to the above post.)


I next ran it on a dataset called "Brain and Organ Imaging Traits", subgroup "Regional brain volumes" (101 brain regions). The data is from the BIG-KP resource. Nothing was significant after multiple test correction (FDR).


Next, I ran LDSC on the FinnGen dataset, which includes 303 traits. There should be little overlap in participants with DecodeME since the participants in FinnGen are from Finland.

Again, the most significant correlation is with depression (more specifically "Depression or dysthymia", rg=0.5310, p=1.1e-57). "Depression" is second most significant, and most of the subsequent correlations are related (mood, antidepressants, recurrent depression, anxiety, any mental disorder).

Other correlations:
8th is "Pain (limb, back, neck, head abdominally)" (rg=0.4655, p=1.4e-43).
13th is "Dorsalgia" (back pain) (rg=0.4316, p=1.7e-29)
21st is migraine (rg=0.4425, p=1.6e-23)


I also ran LDSC on the 4347 traits in the UK BioBank. Looking through for interesting correlations (all positive correlations unless explicitly stated):

Most significant is "Frequency of tiredness / lethargy in last 2 weeks" (rg=0.5657, p=2.5e-67).
2nd most significant is "Seen doctor (GP) for nerves, anxiety, tension or depression" (rg=0.5120, p=2.0e-49).
8th is "Chest pain or discomfort"
12th is "Seen a psychiatrist for nerves, anxiety, tension or depression"
17th is a positive correlation with "General happiness with own health" which seems odd. Maybe the meaning of the trait is reversed
18th is a negative correlation with "Getting up in morning", which makes sense
23rd is "Substances taken for depression: Medication prescribed to you (for at least two weeks)"
25th is back pain
28th is "Diseases of the digestive system"
39th is "Medication for pain relief, constipation, heartburn: Omeprazole (e.g. Zanprol)"
47th is "Wheeze or whistling in the chest in last year"
52nd is "Emphysema/chronic bronchitis" (rg=0.4357, p=3.0e-15)


BIGAGWAS also allows running a tool called LAVA, which looks for regions of local correlation on the genome, instead of correlation based on the entire genome. I don't fully understand how it works, but I thought it might be interesting to see if it can tell me what specific parts of the genome are highly correlated with depression, since that was highly ranked in all three of the relevant datasets. I ran the tool against depression, schizophrenia, and Bipolar II from the PGC dataset mentioned above.

The number one significantly correlated region based on the three traits turned out to be basically the same NEGR1 locus I posted above and was a correlation with depression (p=3.0e-08). (Not that it really matters, but this analysis didn't finish until this morning, so I swear I didn't see this result until after I posted that, so it was quite interesting to see.)

Here is that region with the DecodeME data (converted back to GRCh38 coordinates with UCSC liftOver):
lava1.png
The 2nd and 3rd most significant regions were also correlated with depression:
lava2.png
lava3.png
The 4th most significant was a region correlated with schizophrenia (p=2.5e-07):
lava4.png


Asthma was also highly significantly correlated with ME/CFS in FinnGen (rg=0.3699, p=2.8e-30). In UK BioBank, the correlation with asthma (diagnosed by doctor) was rg=0.2480, p=2.0e-11.

Searching for traits related to "sleep", in UK BioBank, "Sleeplessness / insomnia" was correlated with ME/CFS (rg=0.2357, p=3.6e-11). In FinnGen, "Sleep disorders (combined)" was correlated (rg=0.3123, p=6.1e-14).
 

Attachments

Last edited:
The highest correlation (rg=0.586, p=5.0e-121) is with depression (based on data from this paper). Second most significant was another depression study (though I'm not sure how much overlap there was in participants between the two).
Thanks, I suspect this will be one of the areas where the preprint may need to adjust the wording a bit. There does seem to be a link/similarity to depression based on genetic data.

Most significant is "Frequency of tiredness / lethargy in last 2 weeks" (rg=0.5657, p=2.5e-67).
That seems like a confirmation of the data that this came out on top in the UK Biobank.

Asthma was also highly significantly correlated with ME/CFS in FinnGen (rg=0.3699, p=2.8e-30). In UK BioBank, the correlation with asthma (diagnosed by doctor) was rg=0.2480, p=2.0e-11.
That's a bit surprising. The sleep disorders make more sense.

Does the database also include diseases that ME/CFS is often compared with, such as Multiple Sclerosis, Lupus, or mitochondrial disorders?
 
The DecodeME questionnaire asked about 'Clinical depression' as one of the other conditions participants might have. It would be interesting to see if the answer to this question determines the similarity to the depression GWAS. In other words, if we see similar results in ME/CFS patients, if those with clinical depression are excluded.

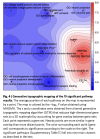
Here's an example of what they found in the first big depression GWAS. Mostly genes involved in neurons and synapses, some pointing to regulation of immune responses and also calcium channel activity.
1756307794285.png

Source: Genome-wide association analyses identify 44 risk variants and refine the genetic architecture of major depression | Nature Genetics
 
Does the database also include diseases that ME/CFS is often compared with, such as Multiple Sclerosis, Lupus, or mitochondrial disorders?
The only result I see of these from a search of the words is multiple sclerosis in UK BioBank and it doesn't look to be significant. (Also all results from all tested traits are in the attached files if you want to explore.)

From UK BioBank:
  • Multiple Sclerosis:
    • Diagnoses - main ICD10: G35 Multiple sclerosis (rg=-0.0713, p=0.6354)
    • Non-cancer illness code, self-reported: multiple sclerosis (rg=0.0051, p=0.9582)
  • The correlation analysis with lupus had an error and didn't work ("WARNING: One of the h2's was out of bounds. This usually indicates a data-munging error or that h2 or N is low.")
 
The highest correlation (rg=0.586, p=5.0e-121) is with depression
I suspect you filtered on the lowest p-values? One issue is that this may be affected by the sample size of the trait rather than the strength of correlation with ME/CFS.

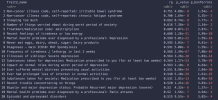
Because we also want to avoid having lots of false positives, I tested an arbitrary threshold of p < 0.00005 and then ranked them according to the highest correlation values (rg) using the UK Biobank data. I think there's a clear link to depression, with multiple categories scoring high (but not as high as IBS and CFS). Anxiety is also up there.

Some weirder findings are:
  • Never eats dairy products
  • Spondylosis

EDIT: update the results to use a bonferroni correction rather than an arbitrary threshold of p < 0.00005. See posts below.

1756314601170.png
 
Last edited:
I suspect you filtered on the lowest p-values?
Yes, just sorted by p-value. (And that enormously significant correlation with depression does come from comparing to a study with an enormous sample size: 371,184 depression cases)

Good idea to look at top correlations. I wonder what that milk one is about. Just under your significance threshold though (and slightly above Bonferroni threshold for all traits in the BioBank).

Edit: Sorry, I see there are two milk related correlations, and one is more significant.
 
Last edited:
Thanks, I suspect this will be one of the areas where the preprint may need to adjust the wording a bit. There does seem to be a link/similarity to depression based on genetic data.
Interesting analysis.

Worth noting that maybe a third of pwME had depression after they relaxed the recruitment criteria. I think they are planning to do a sensitivity analysis with excluding this group. I also gather that depression has a broad signal that correlates with many things (including some gastro diseases (though not so sure on this - I don't know if anyone has seen data on this?)/
 
Good idea to look at top correlations. I wonder what that milk one is about. Just under your significance threshold though (and slightly above Bonferroni threshold for all traits in the BioBank).
Thanks, makes more sense to do a bonferroni correction, the results are largely the same. I assumed that those with an rg value of 9999 are unvalid, so after excluding those I got 3167 remaining tests. So the bonferroni p_value is the p value times 3167.

I will update the results above.
 
Last edited:
Worth noting that maybe a third of pwME had depression after they relaxed the recruitment criteria.
I also think that the UK Biobank has a lot of these depression and anxiety related categories and less for autoimmune or mitochondrial disorders.
There also seems to be a difference between the 0.7-0.75 correlation for CFS and IBS and the 0.5-0.55 for the depression categories.

But in all, it does seem that there is some genetic similarity between ME/CFS and depression.
 
This is rather naive, but what if depression is a secondary factor . As in you become depressed due to ME? Could this signal be due to being depressed because you have ME? Or are these questionnaires narrowing in on pre-ME depression?
This studie is not about if pwME/CFS have depression, but if the genes that are significant for ME/CFS also have been significant in GWASs for depression.

I have no doubt that a lot of depression in ME/CFS is secondary, and a lot of just being sick gets labelled as depression as well.
 
In my experience, the illness in, combination with lack of support and misunderstanding, can easily lead to a lack of pleasant experiences. This deprivation appears similar to depression. I think it would be more accurate to describe it as getting used to having too few good things in life. One gets used to the fact that seeking a positive experience generally does not lead to a positive experience, so there is little drive to do most of the things that a normal person would do to feel good. The few remaining things that give pleasure may be relied upon excessively. The ability to experience pleasure and the desire to do so is intact, but there are far fewer opportunities to experience pleasure without negative consequences.

In less general terms, if going outside tends to make the person feel unwell soon, or if the later consequence is malaise, the person will have little drive to do so, except in ways that are within the tolerated limits. But one must first develop an understanding of the dynamics at play... that the malaise is a delayed consequence and not random, that one must reduce expectations and do less than one would like. And one must also learn to resist the requests or invitations of other people to do as much as a normal person would in the give circumstance. Other people and systems tend to have a negative impact when they don't take accomodate the illness. There's a lot of learning involved if one starts from a position of total ignorance of the illness and confusion about what is happening and what to do.

The state of PEM can also look similar to depression.

There's probably some overlap between risk genes for depression and ME/CFS, just like there is for various other diseases.
 
Last edited:
Back
Top Bottom