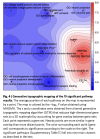
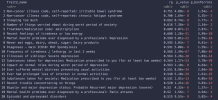
I've now run this tool on a few different datasets using LDSC to find genetic correlations between ME/CFS and other traits. I'll attach all results for download and just mention some specific correlations.
Wikipedia:
In multivariate quantitative genetics, a genetic correlation (denoted rg or ra) is the proportion of variance that two traits share due to genetic causes, the correlation between the genetic influences on a trait and the genetic influences on a different trait estimating the degree of pleiotropy or causal overlap. A genetic correlation of 0 implies that the genetic effects on one trait are independent of the other, while a correlation of 1 implies that all of the genetic influences on the two traits are identical.
First I ran it on the dataset "PGC (Psychiatric Genomics Consortium) and Other Brain Disorders" which includes 24 different phenotypes.
The highest correlation (rg=0.586, p=5.0e-121) is with depression (based on data from
this paper). Second most significant was another
depression study (though I'm not sure how much overlap there was in participants between the two). The third most significant (rg=0.3116, p=1.2e-28) was with
schizophrenia. The fourth was
bipolar II disorder (rg=0.5787, p=1.0e-22). Correlations with many other phenotypes in this dataset were significant as well.
(It was at this point I decided to search PubMed for "depression neurons" just to explore, and I saw a paper about NEGR1, which reminded me that I saw this gene in the locus above, which led to the above post.)
I next ran it on a dataset called "Brain and Organ Imaging Traits", subgroup "Regional brain volumes" (101 brain regions). The data is from the
BIG-KP resource. Nothing was significant after multiple test correction (FDR).
Next, I ran LDSC on the FinnGen dataset, which includes 303 traits. There should be little overlap in participants with DecodeME since the participants in FinnGen are from Finland.
Again, the most significant correlation is with depression (more specifically "Depression or dysthymia", rg=0.5310, p=1.1e-57). "Depression" is second most significant, and most of the subsequent correlations are related (mood, antidepressants, recurrent depression, anxiety, any mental disorder).
Other correlations:
8th is "Pain (limb, back, neck, head abdominally)" (rg=0.4655, p=1.4e-43).
13th is "Dorsalgia" (back pain) (rg=0.4316, p=1.7e-29)
21st is migraine (rg=0.4425, p=1.6e-23)
I also ran LDSC on the 4347 traits in the UK BioBank. Looking through for interesting correlations (all positive correlations unless explicitly stated):
Most significant is "Frequency of tiredness / lethargy in last 2 weeks" (rg=0.5657, p=2.5e-67).
2nd most significant is "Seen doctor (GP) for nerves, anxiety, tension or depression" (rg=0.5120, p=2.0e-49).
8th is "Chest pain or discomfort"
12th is "Seen a psychiatrist for nerves, anxiety, tension or depression"
17th is a positive correlation with "General happiness with own health" which seems odd. Maybe the meaning of the trait is reversed
18th is a negative correlation with "Getting up in morning", which makes sense
23rd is "Substances taken for depression: Medication prescribed to you (for at least two weeks)"
25th is back pain
28th is "Diseases of the digestive system"
39th is "Medication for pain relief, constipation, heartburn: Omeprazole (e.g. Zanprol)"
47th is "Wheeze or whistling in the chest in last year"
52nd is "Emphysema/chronic bronchitis" (rg=0.4357, p=3.0e-15)
BIGAGWAS also allows running a tool called LAVA, which looks for regions of local correlation on the genome, instead of correlation based on the entire genome. I don't fully understand how it works, but I thought it might be interesting to see if it can tell me what specific parts of the genome are highly correlated with depression, since that was highly ranked in all three of the relevant datasets. I ran the tool against depression, schizophrenia, and Bipolar II from the PGC dataset mentioned above.
The number one significantly correlated region based on the three traits turned out to be basically the same NEGR1 locus I posted above and was a correlation with depression (p=3.0e-08). (Not that it really matters, but this analysis didn't finish until this morning, so I swear I didn't see this result until after I posted that, so it was quite interesting to see.)
Here is that region with the DecodeME data (converted back to GRCh38 coordinates with UCSC liftOver):

The 2nd and 3rd most significant regions were also correlated with depression:

The 4th most significant was a region correlated with schizophrenia (p=2.5e-07):
Asthma was also highly significantly correlated with ME/CFS in FinnGen (rg=0.3699, p=2.8e-30). In UK BioBank, the correlation with asthma (diagnosed by doctor) was rg=0.2480, p=2.0e-11.
Searching for traits related to "sleep", in UK BioBank, "Sleeplessness / insomnia" was correlated with ME/CFS (rg=0.2357, p=3.6e-11). In FinnGen, "Sleep disorders (combined)" was correlated (rg=0.3123, p=6.1e-14).