Coronavirus - worldwide spread and control

Status
Not open for further replies.
28,000 Missing Deaths:
Tracking the True Toll of the Coronavirus Crisis


T9TqYNXx

At least 28,000 more people have died during the coronavirus pandemic over the last month than the official Covid-19 death counts report, a review of mortality data in 11 countries shows — providing a clearer, if still incomplete, picture of the toll of the crisis.

In the last month, far more people died in these countries than in previous years, The New York Times found. The totals include deaths from Covid-19 as well as those from other causes, likely including people who could not be treated as hospitals became overwhelmed.
https://www.nytimes.com/interactive...missing-deaths.html?smid=tw-nytimes&smtyp=cur
 
2020 Total Deaths in Spain to date: 144,843

spain - 123,561 Deaths year to date (2020 until today, total deaths without covid19)
https://countrymeters.info/en/Spain
spain - 21,282 Covid deaths to date
https://www.worldometers.info/coronavirus/country/spain/


2018 total deaths to date would make 47 911 + 39 756 + 39 772 + 17.500 deaths (1/2 april) ... = 144 939 (2018 total deaths to date)

number deaths in spain 2018 by month
jan 47 911
feb 39 756
march 39 772
april 34 956
may 33 421
june 31 970
july 32 215
august 33 177
sept 30 293
oct 32 879
nov 34 338
dec 37 033
https://www.statista.com/statistics/450251/number-of-deaths-in-spain-by-month/
also interesting: https://www.statista.com/statistics/450171/number-of-deaths-in-spain/
 
since 8 April the number of deaths in hospitals have been falling when you look at the date of death

https://www.bbc.co.uk/news/health-52361519

If it takes an average of three weeks to go from infection to death, that would indicate that the changes occurring prior to the lockdown had a significant impact:

Prof Carl Heneghan, from the University of Oxford, said he agreed, saying London, which saw rapid increases earlier than the rest of country, peaked even earlier, suggesting the steps taken before full lockdown had an impact.

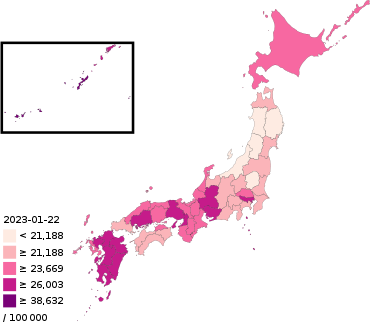
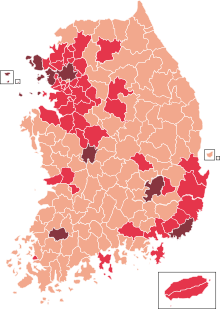
The association between NO2 (or pollution in general) and corona seems to hold, in some sense:
screenshot_2020-04-21-nitrogen-dioxide-pollution-mapped-png.37020

NO2 and corona cases in Japan
370px-COVID-19_outbreak_Japan_per_capita_cases_map.svg.png

220px-COVID-19_Outbreak_Cases_in_South_Korea_%28Density%29.svg.png

corona cases and NO2 (picture on the right) in South Korea
1-s2.0-S0269749116324514-fx1.jpg

https://www.sciencedirect.com/science/article/pii/S0269749116324514

Isn't that going to correlate closely with population density, which seems likely to make the infection spread more quickly?
 
Last edited:
Not sure this has been mentioned previously – just listening to More all Less on R4 and a guy from Oxford University reported that, according to deaths analysed on the actual day that they occurred, rather than the day they were reported, in the UK, deaths appear to have peaked on April 8, which means that new cases will have peaked shortly before lockdown, at a point where schools had closed and people were already starting to socially distance.
 
If it takes an average of three weeks to go from infection to death, that would indicate that the changes occurring prior to the lockdown had a significant impact:

I am beginning to think, looking at the curves, that it may be foolish to infer anything about effectiveness of measures from them. Not that that is an argument against measures, more that this is a situation where 'the science' cannot be useful based on uncontrolled observation of curves so we should maximise measures on the basis of common sense.

The New Zealand and China experiences certainly seem to indicate that with firm measures you can actually remove the virus.

But most of the other curves seem to follow a rather similar pattern irrespective of what has been done. I think this may relate to Alyson Pollock's point that this is not one epidemic but hundreds of sub epidemics, each playing out at a different speed. I think there is reason to think that when you see an initial surge you are quite likely to then see a flattening for a bit and then another surge. So maybe the first surge was all the air travellers and socialite politicians shouting virus at each other. That has a knock on with first and second contacts but may then dampen.

I think it may be a bit like dry rot in window frames. You see nothing much and then sudden ly there is frame full of rot. You think you have dealt with it but next season two other frames are full of rot.

SO if you look at the curves for most countries there is an upsurge, then a rounding off and then a sloping down a bit but then often another little upsurge and another rounding such that in reality case rates are contunuing unabated.

I stick to having said that I think the penny will eventually drop that we all have to try to do what China and NZ have done and sadly my guess that it might take until July does not look to need changing.
 
https://www.ft.com/content/67e6a4ee-3d05-43bc-ba03-e239799fa6ab

Coronavirus death toll in UK twice as high as official figure | Free to read

FT estimate has been updated to reflect latest mortality trends

“The coronavirus pandemic has already caused as many as 41,000 deaths in the UK, according to a Financial Times analysis of the latest data from the Office for National Statistics. The estimate is more than double the official figure of 17,337 released by ministers on Tuesday, which is updated daily and only counts those who have died in hospitals after testing positive for the virus.”
 
I stick to having said that I think the penny will eventually drop that we all have to try to do what China and NZ have done and sadly my guess that it might take until July does not look to need changing.
I wish I shared your optimism.
I see a steady loosening of the restrictions in May and June and then nobody wanting to admit they called it wrong, nor wanting to reintroduce restrictions. So they will continue in denial trying to live with the virus for a few more months until we start all over again.

With a good tracing app, rapid testing and face masks i think some loosening may not be too bad, ie the spread would be delayed substantially, but those are a bit off yet.

There is a lot of talk about reopening society simply because we have to, without any thoughts as to what is going to be different this time.
 
https://www.nytimes.com/interactive...missing-deaths.html?smid=tw-nytimes&smtyp=cur[/QUOTE]
The association between NO2 (or pollution in general) and corona seems to hold, in some sense:
screenshot_2020-04-21-nitrogen-dioxide-pollution-mapped-png.37020

NO2 and corona cases in Japan
370px-COVID-19_outbreak_Japan_per_capita_cases_map.svg.png

220px-COVID-19_Outbreak_Cases_in_South_Korea_%28Density%29.svg.png

corona cases and NO2 (picture on the right) in South Korea
1-s2.0-S0269749116324514-fx1.jpg

https://www.sciencedirect.com/science/article/pii/S0269749116324514

The association between NO2 (or pollution in general) and corona seems to hold, in some sense:


As per @Esther12 I think this is correlation rather than causation. Number of cases (transmission rate) of coronavirus is dependent on density of the population e.g. Singapore migrant workers housed in dormitories.

NO2 levels are primarily due to motor vehicle emissions; therefore, NO2 levels are correlated to population density. However, the data you present does not appear to show that the number of cases of coronavirus is dependent on NO2 levels.

Most likely NO2 levels are correlated to the number of cases of coronavirus i.e. not caused.

Google something like "correlated" and "caused" --- should give you a better explanation!
 
She might refer to the study on the very first Bavaria cluster by our main scientific adviser, Christian Drosten.

Thank you Leila! Yes I think that is probably the study to which she is referring.

According to that the UK advice to discharge positive tested people out of quarantine after 7 days makes sense (as in it seems they can't infect others anymore).

Yes maybe but this is only one study and it’s only looking at nine cases which strikes me as a very small number. Also, all the subjects in the study were mild and described as “all being young- to middle-aged professionals without significant underlying disease”. I wonder if the duration of infectivity might be longer in severe cases. The authors also write in the conclusion “Our failure to isolate live SARS-CoV-2 from stool may be due to the mild courses of cases, with only one case showing intermittent diarrhoea”. So it doesn’t seem unreasonable to consider that a viral analysis might yield different results in severe cases. On the basis of this study, I am not reassured that the UK’s recommended 7-day isolation period is long enough.
 
As per @Esther12 I think this is correlation rather than causation. Number of cases (transmission rate) of coronavirus is dependent on density of the population e.g. Singapore migrant workers housed in dormitories.

NO2 levels are primarily due to motor vehicle emissions; therefore, NO2 levels are correlated to population density. However, the data you present does not appear to show that the number of cases of coronavirus is dependent on NO2 levels.

Most likely NO2 levels are correlated to the number of cases of coronavirus i.e. not caused.

Google something like "correlated" and "caused" --- should give you a better explanation!
Therefore I had added "in some sense".

But then it would be an explanation why Italy had so huge problems only in the north: because NO2 or air pollution in general is very high there. I am not aware - so far - that the population in the north of Italy is especially dense compared to some other regions. Also in China, Wuhan seems to be in the middle of NO2/general air pollution, whereas other areas have a very dense population too.

Another reason might be the association between NO2 and IL-6, and IL-6 and Covid-19, possibly being in part an explanation for symptoms.


And so I thought it would be interesting to see that the correlation holds true for other areas, even as one may see here in first sight NO2 as an indicator of other parameters (traffic, density of population) that may be relevant.

It could of course be that other parameter like an aged population (like in Italy) play a role instead. This would need to be determined for all areas, also how NO2 might shift, if so, over the course of time.
 
28,000 Missing Deaths:
Tracking the True Toll of the Coronavirus Crisis
To me the graphs look a bit too much in line with expected ones.

As far as I had a look, this year has been of a very low mortality until Covid-19, in most countries.

Only the Netherland displayed a mortality quite on the upper average, and then nevertheless mortality went up steeply (though has calmed a bit now, if this is going to continue).
 
I see a steady loosening of the restrictions in May and June and then nobody wanting to admit they called it wrong, nor wanting to reintroduce restrictions. So they will continue in denial trying to live with the virus for a few more months until we start all over again.

My guess is that restrictions will not be eased in May or June. Hancock and Whitty have demonstrated today that they still do not understand the epidemic. They think that having a flat curve with R=1 is 'the peak' and the objective. They have no idea. R needs to be down at 0.25 or less. And even at that level case numbers are not going to change enough to justify any loosening. The risk is not of a second peak because we are still in the first peak. We are not going to start all over again because we have not so far 'stopped' in any sense.

There are people around who understand the epidemic clearly - Costello, Pollock and others. They are still being shut out of the discussion. But I don't see health care workers, and in particular physicians, tolerating any sort of loosening until case number are down by tenfold at least. We will muddle along doing just enough to get nowhere for three more months and hopefully it will then become clear that 'the virus cannot be eradicated' is nonsense and even if it true the strategy has to be to attempt it.
 
I must say I do find it 'worrying' that the people on the TV who are 'in charge' keep going on about not having a second wave when the experts all seem to be saying that there will be somewhere between 3 and 10 waves and that this is just how these things behave.
 
Thank you Leila! Yes I think that is probably the study to which she is referring.


Yes maybe but this is only one study and it’s only looking at nine cases which strikes me as a very small number. Also, all the subjects in the study were mild and described as “all being young- to middle-aged professionals without significant underlying disease”. I wonder if the duration of infectivity might be longer in severe cases. The authors also write in the conclusion “Our failure to isolate live SARS-CoV-2 from stool may be due to the mild courses of cases, with only one case showing intermittent diarrhoea”. So it doesn’t seem unreasonable to consider that a viral analysis might yield different results in severe cases. On the basis of this study, I am not reassured that the UK’s recommended 7-day isolation period is long enough.

Yes the German study was 9 cases, the other linked one from HongKong 94 cases (my post was written confusing, sorry).
 
the experts all seem to be saying that there will be somewhere between 3 and 10 waves and that this is just how these things behave.

I think the experts are only saying that you will get ten waves if you use a partial lockdown with loosening and then lockdown again. With proper lockdown you only have one wave - as we can see the other side of the world.
 
2020 Total Deaths in Spain to date: 144,843
spain - 123,561 Deaths year to date (2020 until today, total deaths without covid19)
https://countrymeters.info/en/Spain
spain - 21,282 Covid deaths to date
https://www.worldometers.info/coronavirus/country/spain/
2018 total deaths to date would make 47 911 + 39 756 + 39 772 + 17.500 deaths (1/2 april) ... = 144 939 (2018 total deaths to date)

number deaths in spain 2018 by month
jan 47 911
feb 39 756
march 39 772
april 34 956
may 33 421
june 31 970
july 32 215
august 33 177
sept 30 293
oct 32 879
nov 34 338
dec 37 033
https://www.statista.com/statistics/450251/number-of-deaths-in-spain-by-month/
also interesting: https://www.statista.com/statistics/450171/number-of-deaths-in-spain/

So that would mean that the total death rate is exactly the same as it always is in Spain or at least in 2020 and 2018?

Yet somehow in 2018 the total death rate without a single death from this new virus that didn't exist in 2018 was higher by around 15%?

In 2018 it was not possible to add covid19 to a death certificate of someone with cancer or heart disease or COPD etc and claim that person died with covid19?
 
Last edited:
Therefore I had added "in some sense".

But then it would be an explanation why Italy had so huge problems only in the north: because NO2 or air pollution in general is very high there. I am not aware - so far - that the population in the north of Italy is especially dense compared to some other regions. Also in China, Wuhan seems to be in the middle of NO2/general air pollution, whereas other areas have a very dense population too.

Another reason might be the association between NO2 and IL-6, and IL-6 and Covid-19, possibly being in part an explanation for symptoms.


And so I thought it would be interesting to see that the correlation holds true for other areas, even as one may see here in first sight NO2 as an indicator of other parameters (traffic, density of population) that may be relevant.

It could of course be that other parameter like an aged population (like in Italy) play a role instead. This would need to be determined for all areas, also how NO2 might shift, if so, over the course of time.

Problem may be, as @Jonathan Edwards has highlighted, that this is a story of many individual outbreaks i.e. not a single uniform event.

Wuhan famously had/has a wet market!

Lombardy had strong links to China via textiles (manufacture in China --- designed in Milan) ---
So comparing Milan and lets say Rome might not be valid.

It reminds me of the reasoning double blinded trials; you'd need seeding of two areas, which only differed in NO2 levels, to test your hypothesis.
 
Status
Not open for further replies.
Back
Top Bottom