ME/CFS Science Blog
Senior Member (Voting Rights)
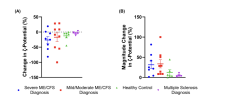
Don't quite understand why figure 32 (below) shows decreases in % change in zeta-potential in ME/CFS patients while on Figure 21 that Murph posted above, it seems that zeta-potential increased after 1.5 hours in the ME/CFS patients.

Figure 32| Normalised ζ-potential data for PBMCs incubated in hyperosmotic NaCl media for 1.5 hours in severe ME/CFS (blue circles: n = 8), mild/moderate ME/CFS (red squares: n = 9), healthy controls (green triangles: n = 6) and MS (purple inverted triangles: n = 4). |A| The change in ζ-potential (%)

Figure 32| Normalised ζ-potential data for PBMCs incubated in hyperosmotic NaCl media for 1.5 hours in severe ME/CFS (blue circles: n = 8), mild/moderate ME/CFS (red squares: n = 9), healthy controls (green triangles: n = 6) and MS (purple inverted triangles: n = 4). |A| The change in ζ-potential (%)
