A recently-posted
Genome-Wide Association Study of Hypermobile Ehlers-Danlos Syndrome (hEDS) (
Discussion) used cross-trait LD score regression to estimate genetic correlations between hEDS and other conditions. The authors found a strong genetic correlation between ME/CFS and hEDS. Genetic correlation was also
referenced by
@forestglip and
@ME/CFS Science Blog in the discussion of the DecodeME results.
I do not have a biostatistics background, so I did not understand this. I read the Bulik-Sullivan et al. paper to improve my understanding by learning about genetic correlation and cross-trait LD score regression.
I’ve made some notes below. If you are like me and are also confused about genetic correlation and LD score regression, I hope my notes provide useful context. On the other hand, if you are familiar with these concepts, feel free to correct any errors I might have made.
What is genetic correlation?
Suppose we have two continuous phenotypes, P1 and P2. Construct a simple additive model in which each phenotype is determined by the sum of all genetic influences G and all environmental influences E.

The genetic correlation between phenotypes 1 and 2 is then corr(G1,G2), the
Pearson Correlation of their genetic influences.
For discrete phenotypes, the definition of genetic correlation is similar, but involves a
link function.
When will two phenotypes be genetically correlated?
The most obvious circumstance in which two phenotypes will have high genetic correlation is when they share an underlying genetic architecture: that is, they are influenced by the same genetic polymorphisms in the same direction. Thus the finding that two diseases have high genetic correlation is often taken to imply that they are driven by related pathological mechanisms. However, see the “caveats” section below for some exceptions to this implication.
How does genetic correlation compare to other approaches for computing genetic commonality between phenotypes?
An intuitive alternative approach to finding the genetic commonality between two phenotypes is to list all the
SNPs found to be individually statistically significant predictors of each phenotype, and then compute the intersection of these two lists. The drawback of this approach is that it neglects all signal from SNPs below the the threshold of statistical significance. In contrast, genetic correlation aggregates signal across all SNPs.
In essence, even if few SNPs are individually statistically significant, the aggregate information from all SNPs may produce a statistically significant genetic correlation.
What are some examples of genetic correlation?
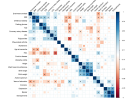
The authors of the present paper use their technique to estimate genetic correlations between a variety of traits and diseases. They produce the following genetic correlation matrix:

Many of the phenotype groupings in this matrix make at least intuitive sense: for instance, the grouping of Crohn’s disease with ulcerative colitis.
What is cross-trait LD score regression?
Traditional methods for estimating the genetic correlation between phenotype 1 and phenotype 2 require access to individual-level data from both a GWAS of phenotype 1 and a GWAS of phenotype 2. Privacy protection rules often make this requirement prohibitive. Bulik-Sullivan et al. propose cross-trait LD score regression, a method that instead relies only on publicly accessible summary statistics from the two GWAS.
This enables a researcher without access to the underlying individual-level GWAS data to nevertheless compute genetic correlations.
How reliable is the cross-trait LD score regression approach to estimating genetic correlation?
I skimmed through the algebraic derivation of cross-trait LD score regression in the supplementary material to this paper, and noticed that it relies on some strong modeling assumptions that seemed unlikely to hold. However, the authors also validate cross-trait LD score regression empirically on real data, and show a good match between genetic correlation estimated from individual-level data and genetic correlation estimated from summary statistics. Use of summary statistics does increase the standard error of the genetic correlation estimates, but not so much as to make those estimates useless.
This suggests that cross-trait LD score regression is viable technique, and that strictly satisfying its modeling assumptions may not be crucial.
What are some caveats to the interpretation of genetic correlation?
- Even though genetic correlation is immune to direct environmental confounding, the finding that phenotypes A and B are genetically correlated does not unambiguously determine their causal relationship. For instance, if G is the shared genetics of two phenotypes, we could have A←G→B or G→A→ B or G→B→ A or A←G→X→B for some X.
- When we compute the genetic correlation between phenotype A studied in GWAS 1 with phenotype B studied in GWAS 2, we are approximately asking the question: “How much commonality is there between the SNPs distinguishing phenotype A from GWAS 1 controls and the SNPs distinguishing phenotype B from GWAS 2 controls?” In theory, differences in control-selection-criteria between GWAS 1 and 2 could bias the result. (I believe this bias could be corrected with access to individual-level GWAS data).
- In theory, two phenotypes could have high genetic correlation not because of truly shared genetics, but because the genes that influence them are in linkage disequilibrium (i.e. they tend to be inherited together).
- @forestglip linked to an interesting discussion of some other un-intuitive causes of high genetic correlation: https://gcbias.org/2016/04/19/what-is-genetic-correlation/


