Ventricular cerebrospinal fluid lactate is increased in [CFS] compared with generalized anxiety disorder, 2009, Mathew et al.

SNT Gatchaman

Senior Member (Voting Rights)
Staff member
Ventricular cerebrospinal fluid lactate is increased in chronic fatigue syndrome compared with generalized anxiety disorder: an in vivo 3.0 T 1H MRS imaging study
Sanjay J. Mathew; Xiangling Mao; Kathryn A. Keegan; Susan M. Levine; Eric L. P. Smith; Linda A. Heier; Viktor Otcheretko; Jeremy D. Coplan; Dikoma C. Shungu

Chronic fatigue syndrome (CFS) is a controversial diagnosis because of the lack of biomarkers for the illness and its symptom overlap with neuropsychiatric, infectious, and rheumatological disorders.

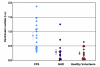
We compared lateral ventricular volumes derived from tissue-segmented T1 -weighted volumetric MRI data and cerebrospinal fluid (CSF) lactate concentrations measured by proton MRS imaging (1 H MRSI) in 16 subjects with CFS (modified US Centers for Disease Control and Prevention criteria) with those in 14 patients with generalized anxiety disorder (GAD) and in 15 healthy volunteers, matched group-wise for age, sex, body mass index, handedness, and IQ.

Mean lateral ventricular lactate concentrations measured by 1H MRSI in CFS were increased by 297% compared with those in GAD (P < 0.001) and by 348% compared with those in healthy volunteers (P < 0.001), even after controlling for ventricular volume, which did not differ significantly between the groups. Regression analysis revealed that diagnosis accounted for 43% of the variance in ventricular lactate.

CFS is associated with significantly raised concentrations of ventricular lactate, potentially consistent with recent evidence of decreased cortical blood flow, secondary mitochondrial dysfunction, and/or oxidative stress abnormalities in the disorder.

Link | PDF (NMR in Biomedicine)
 
I don't think we have a thread for this paper. They used Fukuda criteria and manually segmented the ventricles from brain parenchyma (the latter recognised in their limitations). I think this could be worth replicating in LC and non-Covid ME/CFS, using modern automated segmentation tools.

I've circled below the doublet-peak at 1.33 ppm for lactate, seen only in the CFS group. Note that all groups also had a smaller NAA peak at 2.0 ppm which means their segmentation wasn't perfect and included some brain parenchyma. I don't think that matters as all that might indicate is that lactate is increased in the brain parenchyma as well as the CSF (which it presumably is).

Also another example where the term "CFS" is so unhelpful, with CSF -> CFS typos in the manuscript, which is the opposite of what we often see!

Although our multislice 1H MRSI protocol did not yield voxel sizes that were sufficiently small to completely eliminate contamination from extraventricular tissues, we found no significant differences in ventricular volume across all subjects in this study, indicating that partial-volume effects caused by differences in the relative fractions of [CSF] being sampled do not account for the observed increases in lactate in [CSF]. Another possibility is that CSF lactate might be more readily detectable than parenchymal lactate because of a combination of narrower resonance linewidths, longer T2 relaxation times in CSF than in brain, and, possibly, greater lactate concentration in CSF than in parenchyma.

Screenshot 2024-01-01 at 12.07.55 PM Large.jpeg
 
Looks like they only found high lactate in roughly half of the patients:

It can be seen in Fig. 3 that a subgroup of patients with CFS did not show abnormal ventricular lactate concentrations. In exploratory post hoc analyses, these ‘low lactate’ patients (n ¼ 6) were compared with ‘high lactate’ patients (n ¼ 10), defined as having a lactate concentration > 2 SDs above the healthy volunteer mean lactate concentration. The two CFS subgroups did not differ significantly in any demographic variable (mean age, BMI, IQ, age of illness onset, duration of illness, or sex distribution), clinical rating scale (anxiety, depression, fatigue, sleep quality), or rates of comorbid fibromyalgia.

upload_2023-12-31_17-37-51.png
Maybe this would be one to test in a PEM state (ideally PEM due to cognitive exertion).
 

Attachments

  • upload_2023-12-31_17-37-32.png
    upload_2023-12-31_17-37-32.png
    510.4 KB · Views: 1
Maybe that reflects the presence or degree of cognitive dysfunction / brain fog. I hope the NIH intramural study reports on ventricular and muscle lactate findings in the small cohort, and includes this in the GWI and any LC studies.
 
Maybe that reflects the presence or degree of cognitive dysfunction / brain fog. I hope the NIH intramural study reports on ventricular and muscle lactate findings in the small cohort, and includes this in the GWI and any LC studies.

I'm listening to the NIH research roadmap, and Jarred Younger was saying there was strong evidence of elevated lactate using neuroimaging, which piqued my curiosity.
Jarred Younger said:
probably the most repeated neuroimaging finding in ME/CFS in the history of research using neuroimaging in ME/CFS is elevated lactate. There are several papers showing lactate all throughout the brain in ME/CFS. Some of these papers were done by Benjamin Natelson, who's on the panel today. This uses spectroscopy that can measure different chemicals in the brain.

We use a technique that allows us to measure it throughout the brain. Again, I can't point to it, but you can see it says lactate. Lactate is usually small to non-measurable. That's generally what you want with you have lactate that's measurable in your brain. It suggests that something is wrong, that the cells are not getting the energy that they need. The same thing happens in your muscles when you overwork them. They're going to demand more energy than your oxygen, than your blood supply can provide and so you get an increase of lactate. Same thing in the brain.

It could be that there's extreme hyperactivity such as neuroinflammation. It could be a mitochondrial dysfunction, could be an oxygen perfusion problem. It could be oxidative stress, insufficient glucose. There's a lot of potential causes, but it's telling us something is arrived in the brain and it's generally seen as part of the neuro-inflammatory response.

This picture here, the top is a group of healthy individuals and the bottom is ME/CFS with just a lot more lactate throughout the brain. My graduate student, Indonesia Jordan, provided some first analysis this week and with our NINDS trial, using the scan where we can get lactate and other things. I have not had enough time to scrutinize everything and look at everything. I just wanted to show one quick slide from these analyses. I'll be looking at these more in depth over the next week.

All I wanted to say is that we've previously reported that ME/CFS involves lots of lactate. This really shows this again, the zero group to the left are healthy controls and on the right are ME/CFS participants. What I want to point out here is that while there are lots of ME/CFS individuals who do not have abnormal lactate, you do clearly see that group extending higher on the one column where there is significantly higher lactate and this is about 20 or so percent of the MEC of a sample. These individuals have clearly abnormal lactate that is almost definitely going to be driving symptoms. It's all looking very good and I really look forward to digging into these data and preparing your first reports from this.

I don't know much about what exactly they tested in this thread's study, but is it a comparable test to the Deep Phenotyping study's CSF testing? Lactate was lower there. I got p=0.07 after correcting for the >1200 tests I did (all of metabolomics and lipidomics).

(chart from study for most significant metabolites)
upload_2024-10-28_21-55-22.png

(chart generated by me for just lactate)
lactate_box.png
 
Other ME/CFS studies are generally neuroimaging using 1H MR spectroscopy, measuring intraventricular CSF, but I don't think they did that in Walitt et al. The legend for the most significant metabolites heat map above is —

i Heatmap of statistically significant (false discovery rate adjusted p-value < 0.05) differentially expressed metabolites in the indicated groups on x axis and the metabolites labeled on y axis. Red: upregulated; Blue: downregulated. Supervised clustering of metabolites measured from the cerebrospinal fluid samples

So they are indicating that lactate was downregulated in ME/CFS CSF samples, which is counter to other studies I've seen but those have used MRS.

Eg in Multimodal and simultaneous assessments of brain and spinal fluid abnormalities in chronic fatigue syndrome and the effects of psychiatric comorbidity (2017, Journal of the Neurological Sciences) —

When permitted by the subject, lumbar puncture was then performed with fluid sent to the laboratory for white cell count, protein and lactate concentrations.

There were no significant differences in peripherally obtained spinal fluid lactate levels among groups, and spinal fluid lactate did not correlate with ventricular lactate levels (r = 0.21, p = 0.17).

Pooled CFS patients, but not the CFS-P or CFS-NP separately, had significantly higher ventricular lactate and significantly lower occipital lobe glutathione than healthy controls

Peripherally obtained spinal fluid lactate was a variable that discriminated between the brain-affected group and the patients with b2 of the 4 brain-related outcomes [15.94 (±2.34 SEM) vs. 13.48 (±1.46), respectively; t = 3.22, p = 0.004]; lactate levels in the brain-affected group were also significantly higher than in healthy controls [15.94 (±2.34) vs. 13.05 (±4.27), respectively; t = 2.14, p = 0.043;

It would have been ideal if Walitt et al had done ventricular CSF MRS — they had the patients in the MRI scanner doing functional MRI. Perhaps ventricular lactate is high but direct lumbar cistern CSF sampling is normal or (genuinely?) low in ME/CFS.

Do we have older papers with direct measurements of CSF lactate?
 
Back
Top Bottom