Temporal dynamics of the plasma proteomic landscape reveals maladaptation in ME/CFS following exertion, 2025, Germain et al.

TiredMathematician

Established Member
Highlights

• Plasma profiling of 7,288 proteins during post-exertional malaise in ME/CFS.
• ME/CFS participants show sustained immune, metabolic, and neuromuscular dysregulation during post-exercise recovery.
• Exertion disrupts T and B cell signaling, IL-17 pathways, and mitochondrial metabolism.
• Protein signatures correlate with symptom severity and impaired exercise performance in ME/CFS subjects.
• Sex-stratified analysis reveals distinct molecular responses, underscoring the importance of sex in ME/CFS pathophysiology.

Abstract

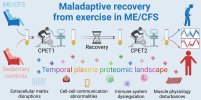
The overarching symptom of myalgic encephalomyelitis/chronic fatigue syndrome (ME/CFS) is post-exertional malaise (PEM), an exacerbation of symptoms following physical or mental exertion. To investigate the molecular underpinnings of PEM, we performed longitudinal plasma proteomics using the Somascan® 7K aptamer-based assay to monitor 6,361 unique plasma proteins in 132 individuals (96 females and 36 males) subjected to two maximal cardiopulmonary exercise tests separated by a 24-hour recovery period. The cohort included 79 ME/CFS cases compared to 53 age- and BMI-matched sedentary controls, allowing us to distinguish disease-specific molecular alterations from those due to physical deconditioning. Longitudinal profiling revealed widespread proteomic changes following exertion, with the most pronounced alterations observed in ME/CFS participants during the recovery phase, coinciding with the onset of PEM. Compared to controls, ME/CFS subjects showed persistent dysregulation of immune, metabolic, and neuromuscular pathways. Key findings included suppression of T and B cell signaling, downregulation of IL-17 and cell-cell communication pathways, and upregulation of glycolysis/gluconeogenesis, suggestive of mitochondrial stress and impaired immune recovery from exercise. Proteomic associations with physiological performance (VO2max, anaerobic threshold) revealed disruptions between protein abundance and exercise capacity in ME/CFS versus controls. Correlations with symptom severity linked changes in immune-related proteins and ME/CFS symptoms including muscle pain, recurrent sore throat, and lymph node tenderness. Sex-stratified analyses revealed distinct molecular responses between females and males, emphasizing the importance of considering sex as a biological variable in ME/CFS research. Finally, our analysis of sedentary controls contributes new data of molecular responses to acute exertion in a predominantly female sedentary cohort, a population historically underrepresented in exercise physiology studies. Together, these findings underscore the value of dynamic, proteomic profiling over time for characterizing maladaptive responses to exertion in ME/CFS and provide a foundation for deeper mechanistic investigation into PEM.

Graphical Abstract
1000088645.jpg

https://www.mcponline.org/article/S1535-9476(25)00566-3/fulltext (Open Access)
 
Funding
This research was funded by U54NS105541, an NIH grant co-funded by the National Institute of Neurological Disorders and Stroke, National Institute of Allergy and Infectious Diseases, National Institute on Drug Abuse, National Heart, Lung, and Blood Institute, National Human Genome Research Institute, and Office of the Director, by NIH U54AI178855 and by the Amar Foundation, and UL1 TR 002384 from the National Center for Advancing Translational Sciences, which provides support for the REDCap database and blood processing at the Weill Cornell Medicine Clinical and Translational Science Center. The content is solely the responsibility of the authors and does not necessarily represent the official views of the National Institutes of Health.
The Amar foundation seems to really believe in the work of the Hanson lab. Dr Hanson has mentioned in webinars that NIH funding didn't provide enough to process as many samples/tests as she would have liked and that she is grateful for the Amar foundation to cover some of this gap.
 
The sad thing is that although they seemed to have found immunological differences in ME/CFS subjects it seems to have been mostly an absence of signals, which doesn't help us much.

I wish they wouldn't use terms like dysregulation and disruption and just give the data.
 
This section seemed key to me.
Key proteins provide novel insights into ME/CFS muscle and brain biology
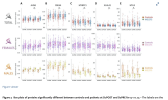
The five proteins highlighted in Figure 2 for the total cohort are functionally linked to muscle or brain function, offering potential mechanistic insights into ME/CFS pathophysiology. Their abundance patterns across timepoints are visualized in Figure 3 using box plots, stratified by total cohort, females, and male (each dot represents an individual). Notably, AHSG and CBLN4 (Figures 3A and 3B), exhibited significantly increased levels in ME/CFS subjects, while muscle-related proteins MYBPC1, KLHL41 and MYL3 (Figures 3C, 3D and 3E) showed significantly decreased levels in ME/CFS subjects at D2PRE. Our exercise protocol particularly accentuated the differences between controls and patients, peaking at D2PRE.
1763145792688.png
Interesting to see insulin signalling, synapse, and muscles come up yet again.
Secreted by the liver, AHSG (Fetuin-A or Alpha-2-HS-glycoprotein) is a multifunctional plasma agent involved in regulating insulin receptor signaling, bone remodeling, and calcium metabolism. It also inhibits pathological calcifications [27] and has been implicated in tumor progression in various cancers [28-30].

CBLN4 (Cerebellin-4) is part of a family of four proteins that form complexes with the presynaptic cell-adhesion molecules neurexins and the postsynaptic glutamate-receptor-related proteins GluD1 and GluD2. It influences synapse connectivity and organization and promotes interneurons differentiation [31, 32]. In mice, it is selectively expressed in specific neuron subsets, including excitatory cortical neurons and mitral projection neurons [32].

MYBPC1 (Myosin-binding protein C, slow type) binds to myosin and actin in skeletal muscles. Mutations are associated with severe myopathies and muscle tremors [33, 34].

KLHL41 (Kelch-like protein 41) is critical in skeletal muscle development and maintenance by regulating myoblast proliferation and differentiation [35]. Mutations cause nemaline myopathy, a congenital muscle disorder [36].

MYL3 (Myosin light chain 3) is an essential component of the myosin complex in both cardiac and skeletal muscles. Declining levels have been associated with osteoarthritis [37], and its release into circulation upon muscle injury suggests it may serve as a biomarker for muscle damage across mammals [38].
 
Last edited:
Myalgic encephalomyelitis/chronic fatigue syndrome (ME/CFS) is a disabling chronic illness that inflicts a slew of symptoms, including but not limited to fatigue, cognitive problems, and muscle and joint pain, that are not alleviated by rest or sleep [1].

Symptom severity constrains the sufferers’ lives, preventing them from engaging fully in daily life, with disability levels ranging from ‘no symptoms at rest’ to ‘severe symptoms on a continuous basis’, sometimes leaving individuals bedridden, hypersensitive to external stimuli, and incapable of self-care [2].

Most ME/CFS patients report that post-exertional malaise (PEM) is the most disabling symptom, as it prevents “pushing through” the other symptoms. PEM is the exacerbation of various symptoms when personal physical, mental and/or emotional exertion thresholds are exceeded [3].

While exercise is generally promoted for maintaining physical health and managing many conditions [4-6], this approach can be counterproductive for ME/CFS patients, in which the body’s response to exercise exacerbates symptoms. Instead, careful pacing is crucial to avoid triggering PEM [7], as repeated episodes can lead to a permanent worsening of the illness and loss of physical and mental functional capacity.
This is one of the better descriptions of ME/CFS and PEM. I think most people reading this would understand why pwME/CFS have to pace.
 
Blood samples were collected 15–20 minutes before exercise on day 1 (D1PRE) and before exercise on day 2 (D2PRE) as well as 15–20 minutes after exercise on day 1 (D1POST) and after exercise on day 2 (D2POST) for a total of 4 time points.
(From their previous paper with the same protocol.)

I'm glad they collected all these data points over time because the strange trends they found kind of align with how confusing and sneaky PEM is. As they mention, the differences between controls and patients were biggest at D2PRE (immediately *before* the second CPET), and actually slightly less dramatic immediately after the second CPET.

This really seems to match my experience of PEM. I often do too much, feel worse the next day, try to continue doing stuff anyway and temporarily feel a bit better (and think for the 1,000th time to myself, maybe *this* will be the time pushing through works) and then feel even worse the day after.

It would be really interesting to see a 5th data point 24 hours after the second CPET.
 
Last edited:
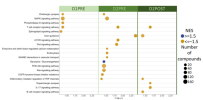
I've only quickly skimmed, but the axon guidance gene set being most significant stood out. This was based on proteins measured before exercise on day 2. The negative enrichment score indicates that proteins in the pathway were downregulated.

Figure 4:
1763172116903.png

These are the leading edge genes in the axon guidance gene set, copied from Supplemental Table 3, meaning they were most downregulated and contributed most to the enrichment:
ABLIM3
FYN
BOC
SRC
PRKCA
EFNB2
WNT5B
UNC5B
EPHB4
PTPN11
ROBO1
PLXNB2
SLIT2
UNC5D
EFNA5
DCC
EFNA2
ROBO2
ILK
PLXNC1
NRAS
LRRC4
PLXNA1
PPP3R1
MYL9
ENAH
MAPK3
EPHA1
EPHB1
PLXNA4
PDPK1
EFNA3
GSK3B
L1CAM
SHH
PPP3R2
SEMA3E
MYL12A


Paper said:
Significantly enriched pathways were defined as those with q < 0.05 and an absolute normalized enrichment score (|NES|) > 1.5 (Figure 4). Full results of the GSEA are provided in Supplemental Table 3.

The following is data copied from Supplemental Table 3, filtered to only those with padj<0.05 and (|NES|) > 1.5. The only data I added was the log10q to compare to the figure.

I see two gene sets that are even more significant and cross the NES ±1.5 threshold, so I don't know why they aren't included in the figure: "Alcoholism" and "Alzheimer disease". Another one that seems to fit the criteria is "Th17 cell differentiation" but it's also not in the figure.

I see a pathway called "SNARE interactions in vesicular transport" in the figure, but not anywhere in Supplemental Table 3.

Some of the log10q values seem different, for example the spreadsheet says "T cell receptor signaling pathway" at D1PRE [edit: D2PRE] has padj=0.00446, which comes out to -log10q=2.35, but in the figure it looks to be closer to 1.85.
TimePoint​
KEGG pathway​
padj​
NES​
-log10q​
D1PREAlcoholism0.03902.321.41
D1PRECholinergic synapse0.0390-1.841.41
D1PREMAPK signaling pathway0.0390-1.631.41
D1PREPancreatic cancer0.0390-1.931.41
D1PREPhospholipase D signaling pathway0.0390-1.821.41
D1PRET cell receptor signaling pathway0.0390-1.781.41
D1PRESphingolipid signaling pathway0.0470-1.781.33
---
D2PREAlcoholism0.00202.252.70
D2PREAlzheimer disease0.0026-1.922.59
D2PREAxon guidance0.0026-1.882.59
D2PRET cell receptor signaling pathway0.0045-1.912.35
D2PREmTOR signaling pathway0.0045-1.882.35
D2PRESignaling pathways regulating pluripotency of stem cells0.0062-1.832.21
D2PREWnt signaling pathway0.0082-1.822.08
D2PRECholinergic synapse0.0170-1.851.77
D2PREEndocytosis0.0170-1.831.77
D2PREMAPK signaling pathway0.0170-1.641.77
D2PREInflammatory mediator regulation of TRP channels0.0175-1.841.76
D2PREEGFR tyrosine kinase inhibitor resistance0.0185-1.771.73
D2PREProteoglycans in cancer0.0185-1.641.73
D2PRERas signaling pathway0.0185-1.631.73
D2PREPI3K-Akt signaling pathway0.0230-1.551.64
D2PREGlycolysis / Gluconeogenesis0.02321.851.63
D2PREToxoplasmosis0.0316-1.751.50
D2PREMeasles0.0327-1.671.49
D2PREHuman papillomavirus infection0.0372-1.551.43
D2PRETh17 cell differentiation0.0393-1.671.41
D2PREDopaminergic synapse0.0445-1.741.35
D2PRENecroptosis0.04781.681.32
---
D2POSTT cell receptor signaling pathway0.0153-1.941.82
D2POSTKaposi sarcoma-associated herpesvirus infection0.0181-1.811.74
D2POSTAlcoholism0.01882.101.72
D2POSTIL-17 signaling pathway0.0188-1.801.72
D2POSTMeasles0.0188-1.801.72
D2POSTAxon guidance0.0262-1.661.58
D2POSTB cell receptor signaling pathway0.0280-1.761.55
D2POSTDopaminergic synapse0.0280-1.821.55
D2POSTEpithelial cell signaling in Helicobacter pylori infection0.0280-1.801.55
D2POSTInflammatory mediator regulation of TRP channels0.0280-1.801.55
D2POSTSphingolipid signaling pathway0.0280-1.761.55
D2POSTFc epsilon RI signaling pathway0.0302-1.771.52
D2POSTToxoplasmosis0.0302-1.741.52
D2POSTFocal adhesion0.0316-1.601.50
D2POSTHuman cytomegalovirus infection0.0378-1.601.42
D2POSTAlzheimer disease0.0382-1.601.42
D2POSTGap junction0.0400-1.731.40
D2POSTHepatitis C0.0498-1.631.30

Edit: Added gap rows between timepoints in table.
 
Last edited:
I've only quickly skimmed, but the axon guidance gene set being most significant stood out. This was based on proteins measured before exercise on day 2. The negative enrichment score indicates that proteins in the pathway were downregulated.

This makes me worry that whatever you hrow at an omics system you get nerve genes coming out, and again it seems that it is not that they are too high but rather low.

I am struggling to see an intelligible story here.
 
Once again, I see how potentially important information may go unnoticed. I am putting here just an example cc @DMissa

Among the genes observed we have CBLN4. So I plugged this gene to the Information retrieval system I have been using : Here are the rankings observe that N-Linked glycosylation and asparagine is ranked higher :

Screenshot 2025-11-15 at 17.01.55.png


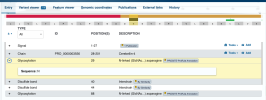
Why? Because CBLN4 is heavily N-Linked glycosylated (observe that it uses asparagine):

Screenshot 2025-11-15 at 17.01.11.png


Have we previously seen mentions on low L-Asparagine? Yes we have and I would like to Thank Dr Xiao for putting this here, related to N-Linked glycosylation (from Study : https://pubmed.ncbi.nlm.nih.gov/40649860/) :

Screenshot 2025-11-15 at 17.12.27.png

My question is : If we have indeed impaired N-linked glycosylation, would that impair Glutamate clearance or not? How about impaired mitophagy?
 
Back
Top Bottom