Running FLAMES on DecodeME data

Quick DecodeME question: did they look for WASF3 (aka WAVE3) and it wasn't significant?

Trying to dial in the extent to which I should hold out hope for Hwang's work. (which tested wasf3 based on an earlier genetic study. https://pmc.ncbi.nlm.nih.gov/articles/PMC3089886/ )
We didn't look for any particular gene, and reported those that reached significance (or near to it) - WASF3 wasn't one of those.
 
Looks like the FUMA website has been updated and now has a portal to do FLAMES.

I've tried to give the correct input, but it would be great if others with more skills could try it out as well.

For the sample size they require, I gave the total DecodeME sample size of cases (15,579) + controls (259,909) = 275,488 rather than the effective sample size of 4 * 275,488 * 15,579/275,488 * (275,488 - 15,579)/275,488 = 58,792
 
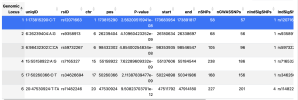
Here's what I got. Looks like it only does the 6 hits that reached significance for the main DecodeME analysis

Which are these:

1779916663664.png

And for the first two it could not make a prediction, too many competitors. For the other 4 he gave the following answers. MMS22L for position 6:98432302:C:CA is new.
1779916637945.png
 
Here's what I got. Looks like it only does the 6 hits that reached significance for the main DecodeME analysis

Which are these:

View attachment 32556

And for the first two it could not make a prediction, too many competitors. For the other 4 he gave the following answers. MMS22L for position 6:98432302:C:CA is new.
View attachment 32555
Are red blood cells back on the table:

MMS22L is a novel key actor of normal and pathological erythropoiesis - PMC
https://pmc.ncbi.nlm.nih.gov/articles/PMC12723439/
 
Hmm doing a bit of googling, with AI, it sounds like if you have a bad MMS22L variant you could have oxidative stress build up in the cell. This could trigger cGAS-STING (something I just learned about) which in turn shoots out type I interferon. This could weave in CD38 over expression on immune cells. (Maybe this is why daratumab works?). Supposedly this is NAD+ heavy which in turn with interferon could mess up the eMSNs and dump CRH, which then blunts the bodys natural response. All sounds bit too good to be true Mr. Gemini....
 
Looks like the FUMA website has been updated and now has a portal to do FLAMES.
Functional Mapping and Annotation of Genome-wide association studies
I've tried to give the correct input, but it would be great if others with more skills could try it out as well.

For the sample size they require, I gave the total DecodeME sample size of cases (15,579) + controls (259,909) = 275,488 rather than the effective sample size of 4 * 275,488 * 15,579/275,488 * (275,488 - 15,579)/275,488 = 58,792
I just did it as well. I think probably effective sample size makes more sense, so that's what I used. For the LD reference, I used "UKB release2b 10k European". I don't know if that or "UKB release 2b 10k White British" more closely matches the DecodeME cohort.

I basically got the same results, but without MMS22L.
1779927068379.png

This seems to be because the main SNP2GENE task only identified 5 loci for me, as opposed to 6 like you got. I'm not sure why that is. The file I upload has the genome-wide significant SNP near that 6th MMS22L locus.

Could you maybe compare the parameters I used to the parameters you used to see what might be different that caused this? It's found under the Parameters tab on the Results page for SNP2GENE.
created_at2026-05-28 01:23:53
titledecodeme_ukb-eur_3
FUMAv1.8.2
MAGMAv1.08
GWAScataloge0_r2022-11-29
ANNOVAR2017-07-17
gwasfilegwas_1_grch37_fuma_valid_chr.tsv.gz
keepinfiles1
chrcolCHROM
poscolGENPOS
rsIDcolNA
pcolP
eacolALLELE1
neacolALLELE0
orcolNA
becolBETA
secolSE
leadSNPsfileNA
addleadSNPs1
regionsfileNA
GRCh380
N58792
NcolNA
exMHC1
MHCoptannot
extMHCNA
ensemblv102
genetypeprotein_coding
leadP5e-8
gwasP0.05
r20.6
r2_20.1
refpanelUKB/release2b
popEUR_10k
MAF0
refSNPs1
mergeDist250
magma1
magma_window0
magma_expGTEx/v8/gtex_v8_ts_avg_log2TPM, GTEx/v8/gtex_v8_ts_general_avg_log2TPM
posMap1
posMapWindowSize10
posMapAnnotNA
posMapCADDth0
posMapRDBthNA
posMapChr15NA
posMapChr15MaxNA
posMapChr15MethNA
posMapAnnoDsNA
posMapAnnoMethNA
eqtlMap0
eqtlMaptssNA
eqtlMapSig1
eqtlMapP1
eqtlMapCADDth0
eqtlMapRDBthNA
eqtlMapChr15NA
eqtlMapChr15MaxNA
eqtlMapChr15MethNA
eqtlMapAnnoDsNA
eqtlMapAnnoMethNA
xqtlsMap1
xqtlsMapdsspQTL/1_suhre_2017/sig_pairs/Plasma_1_suhre_2017.txt.gz, sceQTL/bryois2022Brain/sig_pairs/Brain_bryois2022Brain_Excitatory.neurons.txt.gz
xqtlP1e-3
ciMap0
ciMapBuiltinNA
ciMapFileN0
ciMapFilesNA
ciMapFDRNA
ciMapPromWindowNA
ciMapRoadmapNA
ciMapEnhFilt0
ciMapPromFilt0
ciMapCADDth0
ciMapRDBthNA
ciMapChr15NA
ciMapChr15MaxNA
ciMapChr15MethNA
ciMapAnnoDsNA
ciMapAnnoMethNA
My guess is a different LD reference panel, where the one I used doesn't include that SNP.

Edit: As far as whether to use UKB European or UKB White British, I think European is probably right. The DecodeME paper says:
This association was robust to testing restricted to the genetically more homogeneous White British genetic ancestries subset
They did a sensitivity analysis only on White British, so I guess that means the full cohort was more diverse than that. Plus they say the cohort had European ancestry multiple times.
 
Last edited:
My guess is a different LD reference panel, where the one I used doesn't include that SNP
Yes I used 1000G Phase3 EUR, yours might have been a better choice.

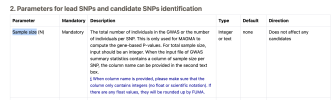
Not sure if that explains the difference though because it's strange that you only got 5 hits. Couldn't it be due to the sample size given? My interpretation is that they want the total number of individuals in the GWAS as explained in the tutorial:
1779947515899.png

created_at2026-05-27 22:07:21
titleMECFS2
FUMAv1.8.2
MAGMAv1.08
GWAScataloge0_r2022-11-29
ANNOVAR2017-07-17
gwasfilefuma.txt.gz
keepinfiles1
chrcolCHR
poscolBP
rsIDcolNA
pcolP
eacolA1
neacolA2
orcolOR
becolBETA
secolSE
leadSNPsfileNA
addleadSNPs1
regionsfileNA
GRCh380
N275488
NcolNA
exMHC1
MHCoptannot
extMHCNA
ensemblv102
genetypeprotein_coding
leadP5e-8
gwasP0.05
r20.6
r2_20.1
refpanel1KG/Phase3
popEUR
MAF0
refSNPs1
mergeDist250
magma1
magma_window0
magma_expGTEx/v8/gtex_v8_ts_avg_log2TPM, GTEx/v8/gtex_v8_ts_general_avg_log2TPM
posMap1
posMapWindowSize10
posMapAnnotNA
posMapCADDth0
posMapRDBthNA
posMapChr15NA
posMapChr15MaxNA
posMapChr15MethNA
posMapAnnoDsNA
posMapAnnoMethNA
eqtlMap0
eqtlMaptssNA
eqtlMapSig1
eqtlMapP1
eqtlMapCADDth0
eqtlMapRDBthNA
eqtlMapChr15NA
eqtlMapChr15MaxNA
eqtlMapChr15MethNA
eqtlMapAnnoDsNA
eqtlMapAnnoMethNA
xqtlsMap1
xqtlsMapdsseQTL/metabrain/sig_pairs/Brain_basalganglia.txt.gz, eQTL/metabrain/sig_pairs/Brain_cerebellum.txt.gz, eQTL/metabrain/sig_pairs/Brain_cortex.txt.gz, eQTL/metabrain/sig_pairs/Brain_hippocampus.txt.gz, eQTL/metabrain/sig_pairs/Brain_spinalcord.txt.gz, eQTL/gtex_v10/sig_pairs/Brain_Amygdala.txt.gz, eQTL/gtex_v10/sig_pairs/Brain_Anterior_cingulate_cortex_BA24.txt.gz, eQTL/gtex_v10/sig_pairs/Brain_Caudate_basal_ganglia.txt.gz, eQTL/gtex_v10/sig_pairs/Brain_Cerebellar_Hemisphere.txt.gz, eQTL/gtex_v10/sig_pairs/Brain_Cerebellum.txt.gz, eQTL/gtex_v10/sig_pairs/Brain_Cortex.txt.gz, eQTL/gtex_v10/sig_pairs/Brain_Frontal_Cortex_BA9.txt.gz, eQTL/gtex_v10/sig_pairs/Brain_Hippocampus.txt.gz, eQTL/gtex_v10/sig_pairs/Brain_Hypothalamus.txt.gz, eQTL/gtex_v10/sig_pairs/Brain_Nucleus_accumbens_basal_ganglia.txt.gz, eQTL/gtex_v10/sig_pairs/Brain_Putamen_basal_ganglia.txt.gz, eQTL/gtex_v10/sig_pairs/Brain_Spinal_cord_cervical_c1.txt.gz, eQTL/gtex_v10/sig_pairs/Brain_Substantia_nigra.txt.gz
xqtlP1e-3
ciMap0
ciMapBuiltinNA
ciMapFileN0
ciMapFilesNA
ciMapFDRNA
ciMapPromWindowNA
ciMapRoadmapNA
ciMapEnhFilt0
ciMapPromFilt0
ciMapCADDth0
ciMapRDBthNA
ciMapChr15NA
ciMapChr15MaxNA
ciMapChr15MethNA
ciMapAnnoDsNA
ciMapAnnoMethNA
 
In the SNP2GENE you can set the p-value threshold lower so that FLAMES will try to predict more genes for loci that didn't reach the 10^-8 threshold. I've tried it using the lower 5*10^-6 threshold to get a higher number of potential genes. It resulted in 56 independent regions with a hit.

I've used the 1000G Phase3 EUR LD reference panel, will try to use the UK biobank LD panel later. The sample size (effective or total) didn't seem to make much of a difference from what I can tell.

For 32 out of 56 regions, FLAMES was confident enough to predict a gene. Here's the list.

ARFGEF2
CA10
UNC13C
MMS22L
SHISA6
SOX6
OLFM4
PEBP1
ZNF644
LRRC7
DCC
RPP40
PLCL1
CACNA1E
VRK2
ALK
VRK2
MICALL2
KIAA1239
NEURL1
NEK1
VPS54
STT3B
RIMS1
PTPRE
NR2F1
PTBP2
RP11-147C23.1
SMCHD1
ADARB2
LAMA2


More info about the results in the attached file. It contains the FLAMES results but I also added the info about the genomic regions from FUMA itself.
 

Attachments

Not sure if that explains the difference though because it's strange that you only got 5 hits. Couldn't it be due to the sample size given? My interpretation is that they want the total number of individuals in the GWAS as explained in the tutorial:
I think you're right about them wanting total sample size. Someone asked them about it, and they said refer to the MAGMA manual since that's the only part of FUMA that uses it. (Though this was before FLAMES was added, so it's possible FLAMES uses it for other reasons as well.)

The manual (linked at the top of the MAGMA webpage) says this:
The N modifier is used to specify the sample size directly (the total sample size, also when using case-control analysis results).

I don't think that should affect whether a locus exists there for SNP2GENE, though. I think that's just calculated based on whether a SNP has a p-value below the given threshold.
 
In the SNP2GENE section of the guide -
Sample size (N) Mandatory
The total number of individuals in the GWAS or the number of individuals per SNP. This is only used for MAGMA to compute the gene-based P-values. For total sample size, input should be an integer. When the input file of GWAS summary statistics contains a column of sample size per SNP, the column name can be provided in the second text box.
and in the FUMA quick start guide -
In this section, the only mandatory parameter is the sample size (N). You can specify the sample size in 2 ways:
Put in an integer represent the same size. For example: 50000 if there were 50000 individuals total (cases and controls) in your GWAS. Do not put in 50000.0 or 50000,0

If sample size is a column in your input GWAS summary statistics, you can specify the name of the column that represent the sample size.
 
For 32 out of 56 regions, FLAMES was confident enough to predict a gene. Here's the list.

ARFGEF2
CA10
UNC13C
MMS22L
SHISA6
SOX6
OLFM4
PEBP1
ZNF644
LRRC7
DCC
RPP40
PLCL1
CACNA1E
VRK2
ALK
VRK2
MICALL2
KIAA1239
NEURL1
NEK1
VPS54
STT3B
RIMS1
PTPRE
NR2F1
PTBP2
RP11-147C23.1
SMCHD1
ADARB2
LAMA2
I put these into an online functional gene enrichment tool called g:GOSt. Here is a link directly to the results: https://biit.cs.ut.ee/gplink/l/awfBEst46QG

Here are the four enriched gene sets based on testing many different gene set sources at once:
term_idterm_nameadjusted_p_valueterm_sizequery_sizeintersection_sizeeffective_domain_sizeintersections
GO:0007268chemical synaptic transmission0.00041676527920972UNC13C,SHISA6,DCC,PLCL1,CACNA1E,NEURL1,VPS54,RIMS1,LAMA2
GO:0043197dendritic spine0.0085516127422155ARFGEF2,SHISA6,NEURL1,LAMA2
GO:0045202synapse0.0159160827922155ARFGEF2,UNC13C,SHISA6,DCC,CACNA1E,NEURL1,VPS54,RIMS1,LAMA2
GO:0031175neuron projection development0.0405101027820972DCC,ALK,MICALL2,NEURL1,VPS54,RIMS1,NR2F1,LAMA2

* There are actually 11 significantly enriched gene sets, but g:GOSt uses a method to try to narrow it down when several significant gene sets are closely related and thus might be significant just because another one is significant. It's explained in their documentation.
 
For 32 out of 56 regions, FLAMES was confident enough to predict a gene. Here's the list.

ARFGEF2
CA10
UNC13C
MMS22L
SHISA6
SOX6
OLFM4
PEBP1
ZNF644
LRRC7
DCC
RPP40
PLCL1
CACNA1E
VRK2
ALK
VRK2
MICALL2
KIAA1239
NEURL1
NEK1
VPS54
STT3B
RIMS1
PTPRE
NR2F1
PTBP2
RP11-147C23.1
SMCHD1
ADARB2
LAMA2
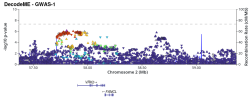
Interestingly, FLAMES pointed to VRK2 from two different loci. Looking at the spreadsheet you provided, the locations are 2:58035555:A:G and 2:58862232:C:T (these are GRCh37 while the plot is GRCh38). These two loci can be seen here:

1779980620650.png
 
I put these into an online functional gene enrichment tool called g:GOSt. Here is a link directly to the results: https://biit.cs.ut.ee/gplink/l/awfBEst46QG
Thanks, seems to confirm what we were already thinking. With the additional tissue enrichment in the brain, cell types pointing to eMSN, and functional gene categories, I think we now have strong evidence that DecodeME points to neural communication as key to the pathology of ME/CFS.

This might be the common pathway for many different subgroups within the ME/CFS label and many different causes for those brain signals. These subgroups and their causes might only show up with much more statistical power.
 
Back
Top Bottom