Trial Report Plasma cell targeting with the anti-CD38 antibody daratumumab in ME/CFS -a clinical pilot study, 2025, Fluge et al

An IgG degrader called efgartigimod (vvygart) was trialed in long covid a couple of years back. It was trialled for POTS, and the primary outcome was a questionaire called COMPASS or something similar.

Many people in the trial reported significant improvement in PEM and POTS/OI, including improved readings on tilt table tests. The drug company ignored all of this, and because it wasnt picked up on their questionnaire, declared the trial failed.

The patients say the questionnaire was a terrible measure of improvement, and last I heard were campaigning for the release of the raw data. I don't think the study tracked PEM at all.

As we have discussed elsewhere in regard to other drugs we can't say for sure why these people improved but a mechanism like you propose here could probably explain it.
Just to add to this, I did a bit of research the other day to refresh my memory. The questionaire was the COMPASS-31.

And there were participants on reddit and in a private lc group im a member of saying they went from having heart rates shoot up from 60ish to 160 on tilt tests to not being symptomatic during a tilt, and not meeting pots criterea anymore. The tilts were part of the trial so i have no idea why this was ignored. Improved PEM was also reported as I said.
 
I then trialed Rinvoq for a month with absolutely no changes to anything.
I was always somewhat skeptical of the idea that a JAK inhibitor would show improvement immediately—Saphnelo for lupus has a reputation for taking months to show an effect, for example.

Which, to clarify, is not me saying that the disease is definitely driven by interferons and if you have stayed on the drug longer it would have worked for you—just that the idea of “take a JAK inhibitor for a few weeks to break the cycle” always seemed contrary to what is known about targeting interferon signaling even if interferon was proven to be the culprit.

Also another point on their theory is they mentioned ammonia is a product of the re-wired TCA cycle in shunting cells, and ammonia is toxic to brain. If that was the case surely CFS would cause permanent brain damage but we have seen in recovery cases that is not the case.
As with all things it is concentration dependent, a certain amount of ammonia is produced and cleared out all the time without toxicity. But regardless I do share skepticism about ammonia mediating symptoms

I just feel like now there is no basis for the theory since it came purely from conjecture and we have other theories that are observation first.
again, any “observation first” theory I’m aware of has issues actually explaining the features of the disease, and those observations are questionable themselves. I’m with you that the particular theory we’re discussing has issues, but I’m not sure I’d agree that we have other theories on much better footing.
 
again, any “observation first” theory I’m aware of has issues actually explaining the features of the disease, and those observations are questionable themselves. I’m with you that the particular theory we’re discussing has issues, but I’m not sure I’d agree that we have other theories on much better footing.
That’s a really good point. We need both a mechanistic theory, the hypothesis and the observations, the evidence. I suppose in some ways it may not matter which comes first but as you said before, it’s usually the hypothesis which leads to the experiments to find the evidence to back it up. That said there are cases when prior observations can be cast in a new light when the right hypothesis comes about. And many a hypothesis which is at least based upon prior observations. A bit chicken and egg perhaps?
 
That’s a really good point. We need both a mechanistic theory, the hypothesis and the observations, the evidence. I suppose in some ways it may not matter which comes first but as you said before, it’s usually the hypothesis which leads to the experiments to find the evidence to back it up. That said there are cases when prior observations can be cast in a new light when the right hypothesis comes about. And many a hypothesis which is at least based upon prior observations. A bit chicken and egg perhaps?
Yup I agree. A viable theory will be able to make sense of a critical mass of important features about the illness (i.e. explaining the symptoms or why PEM occurs after activity, etc.)—a great one will be able to tie together some portion of prior findings as well. It’s just likely that those relevant prior biological findings will be several degrees removed from the disease mechanism itself and unspecific enough that they needed a viable mechanistic theory to connect them all together in the first place.
 
The idea that JAK STAT inhibitors could be beneficial for ME/LC is not exclusive to Ron Davis' group, or a pharma conspiracy. Iirc JE et al. even suggested them as one of the possible treatments in their hypothesis paper.

Whether they work or not, we'll have to wait and see.
 
Last edited by a moderator:
Efgartigimod in the treatment of Guillain-Barré syndrome: case report

Guillain–Barré syndrome (GBS) is a rare neurological disorder characterized by muscle weakness and paralysis. Although the exact etiology remains unclear, the current standard treatments include intravenous immunoglobulin (IVIG) and plasma exchange (PLEX) therapy. While the majority of GBS patients respond well to immunotherapy, some severe cases can be fatal. Efgartigimod, an Fc receptor antagonist, has been utilized in the treatment of various autoimmune diseases. However, its clinical efficacy in acute GBS has been rarely documented. In this study, we administered intravenous efgartigimod to four patients with different subtypes of acute GBS, two of whom received efgartigimod monotherapy without concomitant glucocorticoids, IVIG, or PLEX. The treatment outcomes were favorable, suggesting that intravenous efgartigimod may represent a promising therapeutic option for acute GBS. Further research is warranted to validate these preliminary findings.
 
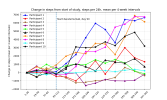
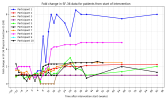
It's kind of hard to make out what's going on in the chart of steps vs. time (fig. 5A) because they all start from a wide variety of baseline steps. So I plotted change in steps from start of study to make it easier to see the timeline of improvement.

steps_change_from_start.png

Each position on the x-axis is an average of 4 weeks. So it takes quite some time to get to the peak, but it looks like the start of gradual improvement in the four with the largest total increases is becoming evident at around 1-3 months.

Edit: Added link to original steps chart.
 
Last edited:
When I look at it like this it looks more like 3 or 4 responders.
I'd say the top four look pretty good. The paper was saying participants 2 (red) and 5 (green) were also responders based on questionnaires, with participant 5 not sustaining the improvement.
Interestingly, for the group of six patients with a clinically assessed improvement during follow-up, the mean SF-36 PF score increased from baseline 32.2 to 78.3, and the DSQ-SF score decreased correspondingly from 71.1 to 24.3 (Table 2). Out of this group of six patients with improvement after daratumumab intervention, five patients had a sustained clinical improvement until end of follow-up (i.e., 52–104 weeks from inclusion).

Participant 2's (red) subjective improvement does seem really close to the other four sustained responders:
Screenshot_20250917-123701.png

Maybe change in steps isn't fully capturing this person's improvement for some reason. 5 [edit: 2] did start from a kind of high number of steps (~5000).
 
Last edited:
Very nice chart @forestglip, respect to you for handling the axis labels and colors so nicely!

02 was the mildest out of all the cases with the SF36 of 45. 05 was the fluctuating one. 05 and 02 are the borderline responders.

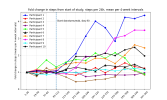
Would be nice to see not absolute change in steps but rather percentage change in steps, so df.pct_change() on the data from when Dara was administered. And side by side with SF36 as well!

And also, baseline NK cell count vs mean SF36 (over the period) rather than max.
 
Last edited:
Would be nice to see not absolute change in steps but rather percentage change in steps, so df.pct_change() on the data from when Dara was administered.
steps_pct_change_from_start.png

Here's the change as a ratio of each time point to the start of the study.

A ratio with the 85-112 timepoint (when the dara was administered) would be kind of misleading because the first dara injection was 5 days into this 28 day range, so the reference point for the start would mostly be data from after the dara was already injected.
 
I guess if you look at 05 as a non responder that weakens the NK cell correlation slightly.

But that to me brings up the debate of NK cell count vs NK cell function in NK-cell recruiting MABs.

@Jonathan Edwards in NK cell killing, how much does the quantity of NK cell matter vs their cytotoxicity? And do you think it is reasonable to say that count correlates with toxicity? E.g patients with low NK cells are likely to have poorly functioning NK cells and patients with normal NK cells have normal functioning NK cells.

Has anyone studied this before?
 
@Jonathan Edwards in NK cell killing, how much does the quantity of NK cell matter vs their cytotoxicity? And do you think it is reasonable to say that count correlates with toxicity? E.g patients with low NK cells are likely to have poorly functioning NK cells and patients with normal NK cells have normal functioning NK cells.

To be honest none of the measures of NK cells we have may tell us much. Numbers in blood do not tell us how many can get to a target. Numbers are probably of some relevance but we do not know how much. Numbers need not correlate with function at all.

I think the separation of responders on NK numbers is impressive, but what it means I don't know.
 
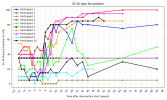
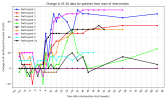
And side by side with SF36 as well!
sf-36.pngdelta_sf-36.pngpct_sf-36.png

First is raw scores, so basically the same as figure 3D, but with consistent intervals on the x-axis. Second is absolute change from timepoint 0 (how many points up or down). Third is fold change from timepoint 0 (e.g. doubling the score would be 2).

And also, baseline NK cell count vs mean SF36 (over the period) rather than max.
I'm not totally sure what this means and I have to take a break for now. Just a scatter plot of mean SF-36 over the whole study to the baseline NK? What would this show?
 
Last edited:
Back
Top Bottom