1. Sign our petition calling on Cochrane to withdraw their review of Exercise Therapy for CFS here.
    Dismiss Notice
  2. Guest, the 'News in Brief' for the week beginning 22nd April 2024 is here.
    Dismiss Notice
  3. Welcome! To read the Core Purpose and Values of our forum, click here.
    Dismiss Notice

Measuring Cognitive Exertion

Discussion in 'Trial design including bias, placebo effect' started by chillier, Jun 12, 2023.

  1. chillier

    chillier Senior Member (Voting Rights)

    Messages:
    188
    I want to try and test some different measures of cognitive exertion and want to document some thoughts here that I might update later (or more likely leave blank as available energy dictates). This will be a bit of a ramble.

    Commercial options for Eye Tracking

    There was some discussion previously about measuring eye movements from a wearable pair of glasses as a proxy for cognitive work, but having looked around it's hard to find a commercial product that does this. Tobii is a company that makes gaze tracking (where your focus lies on a monitor) products for gaming and research, but their products are expensive and they are withholding about how much their glasses based product even costs (probably £300+ based on other products):
    upload_2023-6-12_11-8-5.png
    For counting saccades (eye movements), gaze detection isn't necessary so their set up of of 16 illuminators and 4 cameras probably is probably overkill.

    Keyboard logging programs for windows

    As a trivial cost proxy for measuring cognitive exertion I'm playing with some keyboard activity logging programs to see if button presses or mouse movement correlates. I've found a couple of ultra light weight ones for windows that might be useful.

    KeyCounter tallies minute by minute keyboard button presses (in red) and mouse movement distance (not shown), and provides the following plot (example of my day a couple days ago).
    upload_2023-6-12_11-13-22.png

    WinOMeter tallies keyboard presses, mouse trajectory, left middle and right mouse clicks, and scroll wheel usage and saves these values at the granularity of 1 day, which is probably more useful if you're planning to let this run in the background long term which I am.
    upload_2023-6-12_11-21-40.png

    Data Collection to assess suitability

    To get a sense of whether this metric really makes sense I would like all the metrics of WinOMeter at a higher granularity of 10 minutes. I can't find a program that specifically does this so I've written a python script that launches whenever I turn on my computer and measures/writes all these features to a timestamped spreadsheet every 10 minutes. I am also keeping a log every 10 minutes of whether I feel my cognitive exertion has been very low - very high (highly subjective metric of course), and a note of the general type of activity I have been doing (reading, watching, coding etc). Happy to share the code if anyone would like.

    The aim of all this being that at some point in the future if I have the energy we can see if there is a correlation of patterns of usage associated with exertion/ activity type. You would imagine for example a high exertion activity such as writing this comment would be highly corelated with keyboard presses, whereas something like browsing would involve more scrolling.

    Drawbacks of this approach

    I can think of lots of drawbacks: First being that it's no use if you don't use your computer much or switch between devices a lot. Personally I use my computer almost all of the time I am awake but this won't be true for many people. Some high exertion activities like reading an academic paper probably won't have much keyboard activity at all. Other specific circumstances might have the opposite problem, such as certain video games involving a lot of button mashing with not all that much thinking involved.

    I am of course roughly aware of how much I have used my keyboard in each 10 minutes which could bias my perception of what is high and low mental exertion in my log.

    More generally, what is and isn't cognitive exertion is extremely subjective and also relates to the familiarity to the activity you're doing. Driving a car for instance is probably a lot more mental work for a beginner than for someone experienced - but metrics of activity would likely be the same.

    --------------------

    I'm also playing with some saccade measuring stuff using a webcam or maybe infrared sensors strapped directly to glasses. It's very possible I won't update soon depending on health but we'll see.
     
    Kitty, sneyz, oldtimer and 10 others like this.
  2. NelliePledge

    NelliePledge Moderator Staff Member

    Messages:
    13,301
    Location:
    UK West Midlands
    This is such a good idea, hopefully there will be some good learning that can be passed on to researchers.

    You mentioned gaming not needed much thinking but doesn’t the reaction that leads to pressing the buttons involve a fair bit of cognitive energy. Maintaining concentration and spatial awareness, split second decision making….. same with driving even as an experienced driver you have to concentrate a lot.

    eta although a lot of that cognitive activity is going on subconsciously as opposed to consciously thinking things through it still needs energy
     
    Last edited: Jun 12, 2023
    MEMarge, Kitty, Sean and 5 others like this.
  3. chillier

    chillier Senior Member (Voting Rights)

    Messages:
    188
    Yeah I think that's true and it also depends on the type of video game. There are some that require high reaction times and some that require a lot of 'organisation,' reading bits of text and balancing numbers and puzzle solving. Generally speaking I've found video games a relaxing activity but I know others definitely wouldn't. Reading a fiction book is often thought of as being relaxing but that is mental work for me because I find it hard parsing the small words on the page.
     
    Kitty, Sean, bobbler and 5 others like this.
  4. ringding

    ringding Senior Member (Voting Rights)

    Messages:
    409
    Location:
    Bristol, UK
    This is very interesting. I'm able to work part time but find pacing the cognitive exertion really difficult.

    Will follow with interest.
     
    Kitty, MEMarge, chillier and 6 others like this.
  5. chillier

    chillier Senior Member (Voting Rights)

    Messages:
    188
    Too long, didn't read: Using some python libraries I have a set up which can track eye movements using a webcam. It does ok at detecting large eye movements but struggles with smaller ones which might be more important. I am not sure the data quality will be high enough to be useful at this stage but I'm going to collect data over a while and see. Improvements can probably be made. Happy to share code.

    Webcam based eye tracking

    I've been playing around with using a webcam to count saccades. There are various software options but these are often costly. There is one called Gazerecorder which I think might be free but I haven't tried yet. What I'm really looking for is something that can run non stop in the background, count saccades or some other proxy for eye movement (eg. distance gaze travelled on screen) and record this value every 10 minutes in a spreadsheet format I can go on to analyze myself later.

    Webgazer

    There's a free javascript library called Webgazer which you can embed into a webpage which uses your webcam and turns your gaze into a point on the screen. It's easy to implement on a custom made webpage and you are able to pull out the X and Y coordinates of your gaze pointer on the screen. I wrote a couple of scripts that do this and pass on the data to python which calculates the total eye movement over 10 minutes and saves it.

    It's all very snappy and responsive until I realised as soon as soon as you focus on anything other than the website tab your browser throttles the power of the gaze detection making it almost useless for my purposes. I haven't found a way around that with this implementation.

    Python Opencv and Dlib

    I've had more success using the python libraries opencv and dlib. These libraries allow you to capture video from the webcam and uses a trained neural network to predict the position of your facial features. Using some code borrowed from here we are able to isolate the eye area and predict the position of the pupil taking the centre of the darkest parts of the eye. The blue dots are the machine learning predicted coordinates of my eye area, and the red circle the contrast derived predicted centre of my pupil:
    upload_2023-6-16_14-15-26.png


    From this we can calculate the position of my pupil relative to the eye area. I've taken the distance in pixels the pupil is from the centre of the eye (x and y), and divided these by the width and height of the eye respectively. This gives us a value between -1,-1 and 1,1 where 0,0 would be the eye centre and 1,1 would be top right. In other words I'm accounting for the fact there will be more pixels representing the eye if I'm closer to the camera than further away.

    With my current set up I can only get about 3 frames per second (333ms per frame) which is not ideal, but only slightly longer than the saccade time of 200ms so it ought to be able to capture most saccades in theory. By taking the differences of the pupil coordinates from one frame to the next (ie the gradient) we have a measure of how far the pupil has moved:
    close_eyes_rolling_small.gif

    Here I've set the value of 0.12 as a threshold for whether we have detected a saccade (equivalent to 12% of the distance from the centre to the edge of the eye). Movements smaller than this are hard to distinguish from random noise. Here is a 1 minute trace where I have first moved my eyes a lot, then held them as still as possible, then moved them a little bit:
    webcam_eye_example_better.png

    All together you can see there is a bit of an issue with sensitivity. A lot of saccades will be small ones such as when reading text and this will not be able to pick them up. Additionally, this set up is dependent on decent lighting and its performance varies accordingly. I sit at a bit of an angle to my webcam usually and relatively far away from it. I think for some using a laptop where their webcam faces them squarely and in close proximity this may work better. The script also uses a bit of computing power which may not be practical. Nevertheless I'm going to let this run in the background for a while and collect some data and see.
     
    Last edited: Jun 16, 2023
    Kitty, sneyz, Sean and 4 others like this.
  6. chillier

    chillier Senior Member (Voting Rights)

    Messages:
    188
    Too long, didn't read: I've jerry-rigged some sensors to a pair of glasses and am able to count eye movements with them. It's certainly not perfect but it works pretty decently for how precarious this prototype set up appears. If you want to get a sense of its performance just look at the last gif. It still has various limitations such as not handling blinking very well and generally not being much of a fashion statement. Hope you're able to see past the heavy compression of these gifs.


    Infrared glasses based eye tracking

    I've knocked together this set up to count eye movements with a pair of infrared based sensors.
    upload_2023-6-27_16-24-9.png
    I am using a simple arduino (left) set up. If you're not familiar, an arduino is basically a programmable device which allows you to interface with electronic components, do a small amount of data processing and pass data to a computer using the USB serial.

    On the glasses I have crudely mounted two QTRX-HD-01A infrared reflectance sensors (the second set of sensors I have tried after the first set lacked the range I need).
    upload_2023-6-27_16-31-49.png
    These contain a 3.5mA infrared LED next to a infrared phototransistor. When a reflective surface passes within its maximum range of 3cm the reflected infrared light hits the phototransistor and allows the current to flow to ground, providing a variable analog output depending on the reflectance. The arduino has been programmed to read off an analog signal from the sensor once every 2.5 milliseconds. I then clean up the signal a bit by averaging over multiple readings, and then take the difference between the cleaned up signal at each time step to get the change in reflectance at 50ms time steps. I am using the change in reflectance because a change in reflectance may mean the eye is moving and should show up as a peak when plotting the change over time.

    Sensor physical configuration

    I am using two sensors here, one just above the eye pointing slightly downwards towards it and the eyelid, and the other below the eye pointing to an area just under the eye. The latter sensor is used to calibrate the first one, as it will pick up changes in background lighting and bumps that are not due to eye movement such as when adjusting the glasses. It doesn't do this perfectly but goes some way towards nullifying these signals. As you can imagine I've played with these sensors in a lot of different configurations and this one seems to work best from what I've tried so far.
    Here you can see how saccades and blinks are picked up as peaks when we plot the change in reflectance. The detection and calibration sensors are shown in red and green respectively, and the faint horizontal line represents a threshold which seems to delineate signal from noise relatively well.
    IR_sensor_trace.gif

    Saccade counting

    Using a python script to read from the serial output of the arduino we can read off these values and with some basic thresholding we are able to pick out saccades quite well. I've additionally set the condition that a saccade must not last longer than 300ms and be at least 200ms since the beginning of the previous saccade. Here is the result and an estimate of the length of each saccade:
    IR_sensor_saccade_counting.gif

    Limitations

    This set up performs considerably better than the webcam based eye tracking, but still may have problems with sensitivity depending on brightness. Despite my efforts at accounting for non eye movement related bumps it still often picks these up. It can also get confused with non saccadic eye movement, such as the smooth movement the eye does when you're tracking a moving object. Due to the position of the sensor above the eye, it has better sensitivity when you're looking further in the upper range than the lower range. It also is not quite sure what to do about blinks which it sometimes counts and sometimes doesn't. The glasses with all this stuff on are also not particularly comfortable and looks slightly ridiculous. Unfortunately I can't collect data for both the glasses and the webcam at the same time as the glasses partially obstruct the view from my webcam.
     
    Last edited: Jun 27, 2023
    Kitty, sneyz, obeat and 8 others like this.
  7. chillier

    chillier Senior Member (Voting Rights)

    Messages:
    188
    Adding blink counting functionality to IR glasses

    Supposedly when you are concentrating you blink less frequently, so I've added some extra code to the IR saccade counter set up above that tries to count blinking specifically. Blinks have a different kinetic profile to saccades as shown here. This is the same type of plot as in the previous post (red = top sensor trace, green = calibration sensor trace, blue = threshold).
    You can see while saccades are sharp clean peaks, blinks are formed of a big peak (eyelid going down) following by a much broader smaller peak (eyelid coming up and slowly settling back into position).
    saccade_v_blink_trace_labels.png

    It's a bit awkward to try and pick these out using code as the overall shape of a blink can kind of vary (sometimes crosses the threshold sometimes not, width can vary, sometimes looks like one big peak with a long tail etc). The sensitivity is not that great but nevertheless is another piece of possibly relevant information.

    As an aside, I also tried setting up a convolutional neural network (a type of machine learning that is particularly good at dealing with time series data), which i've asked to predict how many saccades and blinks there are in each 5 second block of data. Getting the training data is a pain though. You have to sit down and in each 5s block of data write down how many times you moved your eyes and blinked, and do this many many times. I generated 500 pieces of training data and that was enough to get it to sort of work. I can only imagine how good it would be if I collected 1000-10000 pieces of training data - if I ever try to turn this into a more permanent device (unlikely) maybe I'll revisit this.

    I'll try to refrain from tinkering any more with this and just let it run.
     
    Last edited: Jul 1, 2023
    Kitty, sneyz, oldtimer and 2 others like this.
  8. chillier

    chillier Senior Member (Voting Rights)

    Messages:
    188
    Too long, didn't read: I've stopped collecting data and plan to analyze it. If the data is useful then the differences should be obvious but I've 'pre-registered' a mini analysis here anyway. This is not necessarily the best plan and I'm very open to critique. Most analysis will be exploratory. P.S I'm aware this post in particular is pretty dry but it's good to have this here as a record and for transparency in my opinion.

    Analysis Plan

    I've stopped collecting data now - it's pretty tedious making a note of what you're doing every 10 minutes and the glasses are not very comfortable! I was quite diligent collecting data in June and then was much more sporadic in July, but nevertheless should have well over 1000 datapoints. I'll have a look at the data when I have the energy. Hopefully the data will be in an ok state and I haven't made any mistakes - but if I have that's ok I will just have to learn any lessons and have a second go at this at a later date.

    Hypothesis testing

    I'm going to take an exploratory approach with the data for the most part but I'll 'pre-register' a couple of tests here in advance for some hypothesis testing. To be honest, for any of these methods to be actually useful as a way of measuring cognitive exertion then the effect sizes should be huge and the differences immediately visible to the eye - but I'm doing this testing anyway for the sake of being thorough.

    As I don't know the shape the data will be in I can't say what the most appropriate way to analyze it is for certain, so I'll try to make the plan work with as few assumptions as possible.

    I want to know whether different features are able to distinguish between cognitively demanding activity and non cognitively demanding activity, and which feature is able to distinguish them most reliably.

    Each data point represents a 10 minute interval which is associated with a certain activity.

    1) When looking at the metadata but prior to analysis I'll pool the activities into groups of 'demanding' and 'not demanding' - I'll report these groupings before doing the analysis.

    2) I'll then test the difference in means between the two groups for these features: number of keyboard presses, mouse movement distance, and saccade count (glasses).

    3) To avoid assumptions of normality and any other assumption I'll use a permutation based approach to testing by scrambling data labels and calculating differences between group means to generate a null distribution.

    4) I'll then do a one-tailed test (testing if the 'demanding' group data for a given feature is higher than 'non demanding' group) to generate p value from this null distribution for the real data.

    5) I'll multiply the p values by 3 for bonferroni multiple testing correction.

    6) If the data appear normally distributed from a histogram and kolgorov-smirnoff test then we can compare which feature is best by directly comparing their cohen's D values (effect size), otherwise I'll use a non-parametric equivalent cohen's U3.


    Exploration

    Here's a non exhaustive list of some of the analyses I may do:

    a) There's lots of other features besides the ones above eg subjective measures of exertion (high to very low), saccade counts from the webcam, blinks, scrolls etc. so I'll visualize all of those as scatter plots.

    b) I may also look at the shape and distributions of the data generally. Based on this I may decide that transformations of the data (eg log transform) would be more appropriate for downstream analyses

    c) I'll probably do a PCA of the keyboard related features and plot blinks versus saccades (glasses) in 2D.

    d) I also collected data on the overall brightness detected by the glasses sensors so we can check whether that introduces a bias and potentially account for that.

    e) I suspect that different keyboard features will capture different types of demanding activity so I may try and put these features into a linear model to try and get a better predictor of cognitive exertion - doing that I'd split the data into probably 2:1 training: testing.
     
    bobbler, Kitty, sneyz and 6 others like this.
  9. obeat

    obeat Senior Member (Voting Rights)

    Messages:
    682
    Thank you for your efforts on this @chillier
     
  10. sneyz

    sneyz Established Member (Voting Rights)

    Messages:
    35
    Great job, I really appreciate this initiative! I have been daydreaming along the lines of something like this as an objective endpoint for assessing PEM.


    I have a suggestion (which you already may have discarded in favour of computational efficiency ;)):

    - On the keyboard side of things, would it be an idea to incorporate word recognition capabilities in order to measure word finding ability more directly? This would also make way for measuring the variation of language in terms of frequency and width of vocabulary etc., which I think could be interesting variables.
     
    Last edited: Aug 14, 2023
  11. obeat

    obeat Senior Member (Voting Rights)

    Messages:
    682
  12. chillier

    chillier Senior Member (Voting Rights)

    Messages:
    188
    Good idea! although I think I'm looking at this from a different angle. Here I'm really trying to find good ways to track how much cognitive work a person doing, in the same way a wrist band can measure steps as a proxy for physical activity. So then it could be used as as an aid to check if you are overexerting yourself, or also be used as a research tool in future to look at the relationship between how much someone has cognitively exerted themselves over a certain period and how their health changes/ whether PEM is brought on.

    Sounds like you're thinking in terms of measuring levels of cognitive fatigue/dysfunction of the user - providing possibly an objective measure of eg PEM as you say. I agree this is interesting too and probably the things I'm looking at could be repurposed to that end. I suppose you'd want to measure things like response time to a stimulus and things like how quickly you can find/type out words as you suggest. @obeat mentioned the thread about a research project looking at this kind of thing which will be interesting to follow.
     
    bobbler, alktipping, sneyz and 3 others like this.
  13. Bantram

    Bantram New Member

    Messages:
    3
    I'm wearing a fitness tracker all the time. The fitness tracker also measures 'stress'. In my case, this corresponds quite well with my cognitive exertion.
     
    bobbler, Peter Trewhitt and Trish like this.
  14. Trish

    Trish Moderator Staff Member

    Messages:
    52,379
    Location:
    UK
    Does it explain how it measures stress?
     
    bobbler and Peter Trewhitt like this.
  15. chillier

    chillier Senior Member (Voting Rights)

    Messages:
    188
    Interesting, my fitness band also measures stress but I've never really looked at it. Looking at it now it seems like it's been taking measurements for me too infrequently to be able to marry up to the data I collected here.

    In my case I've no idea!
     
    bobbler, Peter Trewhitt and Trish like this.
  16. Bantram

    Bantram New Member

    Messages:
    3
    not really. The vendor says that they use the method of the company Firstbeat Technologies Oy. Firstbeat Technologies Oy says that heart rate variability data is used for calculating autonomic nervous system activity. They have published their method in a white paper:'Stress and Recovery Analysis Method Based on 24-hour Heart Rate Variability by Firstbeat Technologies Ltd. '
    But I could not find a proper algorithm in that paper.
     
  17. Trish

    Trish Moderator Staff Member

    Messages:
    52,379
    Location:
    UK
    Thank you, @Bantram. I looked up the so called 'White paper' which is how they describe research papers published on their website, so presumably not peer reviewed or submitted to a medical or scientific journal.
    Stress and Recovery Analysis Method Based on 24-hour Heart Rate Variability – Firstbeat White Paper
    Link on the web page to the PDF of the 'white paper'.

    Quote from the paper:

    Summary:

    Autonomic nervous system (ANS) plays a key role in maintaining physiological functions of the body, including flexible and appropriate regulation of the cardiovascular system according to the task or behavior.

    • Stress is a part of normal daily life, and physiologically manifested by increased sympathetic and/or diminished parasympathetic activity of the ANS.

    • Recovery periods such as sleep are regularly needed to replenish the body physiologically and psychologically. Recovery occurs when physiological arousal is diminished, and parasympathetic activity dominates the ANS state.

    • Heart rate variability (HRV) is associated with ANS activity and it can be used for modeling physiological stress and recovery reactions.

    • The analysis method presented in this paper utilizes HRV from long-term (24-hour), real-life measurements to analyze stress, recovery, and physical activity.

    • The method can be utilized widely to explore and improve well-being, health, and performance.

    ...


    ANALYSIS PROCEDURE Next, the procedure for analyzing different physiological states is described in greater detail. Figure 6 clarifies the analysis procedure for detecting stress, recovery and physical activity. First, the beat-to-beat heart rate data is collected and prepared. Then, required physiological information for state detection is calculated, including HRV variables, respiration rate, oxygen consumption (VO2), and excess post-exercise oxygen consumption (EPOC). Thereafter, physiologically stationary segments are identified, and different states recognized. The following paragraphs describe each of these steps.

    ...
     
  18. MarcNotMark

    MarcNotMark Senior Member (Voting Rights)

    Messages:
    336
    I use a Garmin and they also link to "Firstbeat"

    What I noticed is that very often my stress levels are a lot higher during sleep compared to when I'm awake and resting.

    Sometimes this lasts the whole night and sometimes stress levels go down halfway the night after a bathroom break (it acts like a reset).

    It kind of explains (my interpretation) what I often experience that after a good day, even after uninterrupted night of sleep I wake up broken, in these cases they also say that my body battery did hardly charge during the night (or even went down IIRC).

    They say a normal stress level during sleep would be below 15.

    Some examples of stress levels during sleep:

    2023-08-15 15.29.46 copy.png


    2023-08-15 15.29.22 copy.png


    2023-08-15 11.43.51 copy.png
     
    ahimsa, Sean, bobbler and 3 others like this.
  19. chillier

    chillier Senior Member (Voting Rights)

    Messages:
    188
    Metadata

    Here are some general properties of the data I've collected. As a reminder, a data point is a 10 minute block of time where I have recorded roughly what I was doing and may have features such as saccades and key presses etc associated with it.

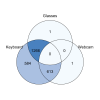
    In my activity log I have recorded 3068 data points describing what I was doing and how much I feel like I exerted myself (in ordinal categories: very low, low, medium, high). I've decided to discard data points where I've noted I was 'away from computer.' This leaves 2772 data points.

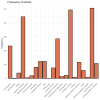
    Here is a bar plot showing the frequency of each 'activity' associated with the collected data points:
    frequency_activity.png
    As you can see it's quite a whimsical list. My general approach while I was recording the data was to choose a descriptive label of what I had just done in general terms, and if what I had just done fit nicely into a label I had previously chosen I would use that one. In that way I only have a handful of 21 different activity labels, even if they don't all fit perfectly.

    I've decided to remove data points associated with activity labels physical activity, nap, sleep, and petting dog for further analysis as I think there's a reasonable chance I'm not wearing the glasses for these activities. This leaves us with 2,514 data points.

    Here is a Venn diagram showing the breakdown of data points collected by the different instruments (that are also in the filtered activity log above). As mentioned before I couldn't wear the glasses and use the webcam at the same time:
    features_venn.png
     
    Last edited: Aug 25, 2023
    Peter Trewhitt likes this.
  20. chillier

    chillier Senior Member (Voting Rights)

    Messages:
    188
    To clarify some of the less clear activity labels from the bar plot above:

    physical activity is used to describe things likes brushing teeth, taking a bath, making food and so on. Petting dog should probably have been labelled with physical activity.

    problem solving usually means things like coding or researching something online.

    general browsing is for relatively passive browsing like watching a bit of a clip of something/ reading a bit of something that doesn't fit nicely into any other specific category. mindless scrolling (slightly facetious label admittedly) would be something like just scrolling endlessly on twitter - it's a more explicitly braindead version of general browsing

    reading academic material basically means reading a paper or maybe a dense post on s4me and writing academic material would be like what I am writing right now. mental exercises are things like solving puzzles, or learning piano chords.

    Pooling data

    So, as per my analysis plan, what I think I will do is pool data points with labels mental exercises, problem solving, playing piano, reading academic material, watching academic content, and writing academic material into the cognitively 'demanding' category.

    I'll therefore pool conversation, daydreaming, eating, general browsing, listening to podcast, messaging, mindless scrolling, playing game (controller), playing game (keyboard), reading, and watching video into 'not demanding.'

    Some of those choices might be a bit contentious, let me know if you disagree with them. Conversation can be cognitively demanding especially depending on what you are talking about, and similarly playing a video game might be demanding for some. This way of categorizing the data doesn't preclude us from analyzing it in other ways in the exploratory part of the analysis.


Share This Page