Understanding Statistics

Sean

Moderator
Staff member
A thread for resources for learning about and understanding statistics, particularly as it applies to medical science.

----------

EDIT (15 Sep 2025): The YouTube channel I originally linked to has changed their name and YT link. The new one is numiqo.

Otherwise they are the same channel and content, far as I can tell.

(Old name and link: DATAtab - Online Statistics Calculator and e-Learning)
 
Last edited:
Just posting some interesting stuff I'm learning.

Over here I'm working on testing correlations between ME/CFS severity and every lab test they did to see what's most correlated:
Amazingly, two participants are still tied. They had the same PEM and SF-36 scores (not all SF-36 domains were identical, but they happened to add up to the same number). I don't know if I'll just let them be tied or try to think of another tiebreaker.

The severity metric I'm planning to use has a tie, so I was curious if the correlation function I was planning to use, Spearman rho, is okay with ties. Ties meaning multiple participants have the exact same value for one or both variables. e.g. two participants have a severity of 5. And I remembered that of the ~3000 lab tests and survey questions, there are many, many ties, especially with surveys.

Multiple sources, like this one, say Kendall's tau is more robust to ties:
Kendall’s tau is said to be a better alternative to Spearman’s rho under the conditions of tied ranks.

So I'm learning a bit about Kendall's tau.

Kendall uses a different method for measuring correlation of ordered data. (Like Spearman, it is a non-parametric test, so only order of points matters, not actual values.)

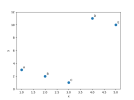
Using this data as an example:
A (1, 3)
B (2, 2)
C (3, 1)
D (4, 11)
E (5, 10)
4.png

Kendall's tau (τ) looks at every pair of points, so A and B, A and C, A and D, B and C, B and D, etc. And it checks if the pairs are concordant or discordant. Concordant means as x increases, y also increases. Discordant means as x increases, y decreases.

So A and B would be a discordant pair because x increased but y decreased. Basically a line slanting down between the two points. A and C would also be a discordant pair. A and D would be a concordant pair because both x and y increase.

So Kendall counts how many concordant and discordant pairs there are between all pairs of points. In this case there are 6 concordant pairs (AD, AE, BD, BE, CD, CE) and 4 discordant pairs (AB, AC, BC, DE).

Then it does a simple equation (C and D stand for number of concordant and discordant pairs):
(C-D)/(C+D) = (6-4)/(6+4) = 0.2

It returns a result between -1 and 1, with 1 being perfectly positively correlated (y always increases as x increases) and vice versa.

So 0.2 is the correlation coefficient. It has a small positive correlation.

Another way to picture it is by looking at all lines that connect every pair of points, like the following where positively sloped lines are green and negative are red. (I slightly moved a couple points so the lines wouldn't overlap.)
small_lines.png
There are more green lines than red lines so the correlation is positive.

I think the equation might be slightly more complicated if there are ties.

The calculation for the p value is more complicated and I'm not sure of the details.

-----

One interesting illustration for the different results from Spearman and Kendall for the following data (example borrowed from a Reddit comment):
5.png

Kendall's tau is negative: -0.12
Spearman's rho is positive: 0.2

Here's that green/red line way of visualizing it, although there's too many to easily see how many there are more of from a glance, but we know it's red from tau being negative. (Again moved points a bit to prevent line overlap, which doesn't affect tau.)
big_lines.png

Or here's some real data. I found a random dataset for diabetes patients. The plot of bmi vs HbA1c for only 16 random people with unique values, since I don't really know how it handles ties yet:
just_dots.png

With the lines:
bmi_lines.png

It does look like more green than red. And that matches the result of running the test. Tau=0.35, p=0.06. The higher the BMI, the higher the HbA1C.

And out of curiousity, I looked at the entire dataset of 100,000 people:
all_bmi.png

Doing the test, there is a very small positive correlation of tau = 0.045, p=2.3x10^-89.
For spearman it's rho = 0.06, p=1.7x10^-89, so pretty close.

Check out those p values. Wouldn't it be cool if every study we looked at on ME/CFS had 100,000 participants?
 
Last edited:
I found a nice overview of Mendelian randomization. Here's the short version, but I recommend reading the full page if interested.
TL;DR (100 word version): Observational epidemiological studies are influenced by reverse causation and confounding. Mendelian randomization is an epidemiological approach with the potential to avoid such biases. The technique assesses whether genetically-predicted levels of a risk factor (such as coffee drinking) and a disease outcome (such as cancer) are associated. By Mendel’s laws, characteristics are inherited independently of each other, meaning genetic associations are less susceptible to confounding. Furthermore, as genetic variants are established from birth, the potential for reverse causation is diminished. Therefore, associations in a Mendelian randomization study are more likely to have a causal interpretation than those from conventional epidemiological analyses.
 
Merged posts
----------------------


But my understanding was that for [edit: any one specific] test, it will never tell you anything other than whether you can reject the null hypothesis. The logic of the test is not reciprocal in that way.
I've been going down a p value rabbit hole the past couple days because it annoys me when something that seems like it should be intuitive isn't. This page explaining p values is excellent if you're interested.

But anyway, specifically regarding your quote, which earlier I agreed with, here's a relevant quote from that page:
In the context in which a low p-value is evidence against the null hypothesis (that is, when the statistical power of the test is held constant), having a high p-value is indeed evidence in favor of the null hypothesis, because a high p-value is more likely to occur if the null hypothesis is true than if it is false. It's not necessarily very strong evidence, but the law of conservation of expected evidence requires it to be nonzero. If you walk in the woods and see no humans, that is weak evidence towards there being no humans on the planet, and the more of the planet you explore while still seeing no humans, the stronger and stronger the evidence becomes.
 
Last edited:
I've been going down a p value rabbit hole the past couple days because it annoys me when something that seems like it should be intuitive isn't. This page explaining p values is excellent if you're interested.

But anyway, specifically regarding your quote, which earlier I agreed with, here's a relevant quote from that page:
Thanks for the link! That’s interesting, I suppose that makes sense now that I think about it. My intuition still makes me cautious about whether it’s valid to make inferences about anything other than rejecting the null hypothesis. I’ll have to sit with that a bit more
 
My intuition still makes me cautious about whether it’s valid to make inferences about anything other than rejecting the null hypothesis.
Oh yeah, I don't take it as much more than an interesting fact that if it is p=.99 the null hypothesis is at least slightly more likely to be correct than if p=.50. I think you'd probably have to do much more math to quantify if that's to a degree that's useful for any given test.

Edit: Though I'm not totally sure what I said is true. I didn't dig much deeper into high p values, just thought the quoted part might be interesting.
 
Last edited:
But anyway, specifically regarding your quote, which earlier I agreed with, here's a relevant quote from that page:

"having a high p-value is indeed evidence in favor of the null hypothesis, because a high p-value is more likely to occur if the null hypothesis is true than if it is false."

I have a problem with that statement (if the "evidence" is supposed to be meaningful evidence).

This is from a well known consensus paper:

6. By itself, a p-value does not provide a good measure of
evidence regarding a model or hypothesis.
Researchers should recognize that a p-value without
context or other evidence provides limited information.
For example, a p-value near 0.05 taken by itself offers only
weak evidence against the null hypothesis. Likewise, a
relatively large p-value does not imply evidence in favor
of the null hypothesis; many other hypotheses may be
equally or more consistent with the observed data.

https://www.tandfonline.com/doi/epdf/10.1080/00031305.2016.1154108?needAccess=true
 
That does make sense, thanks for that paper.
It really is a rabbit hole.

The best way if one wants a deep understanding is imo literally to "do the math" from the beginning and forget the intuition.
Write it down mathematically & deduce what is desired via known theorems (shortly spoken).
Unfortunately I can't do that kind of deep thinking anymore due to symptoms (hello 24/7 severe headache).
And testing in a way medicine needs it is not common in my domain (physics).
 
Last edited:
"having a high p-value is indeed evidence in favor of the null hypothesis, because a high p-value is more likely to occur if the null hypothesis is true than if it is false."

I have a problem with that statement (if the "evidence" is supposed to be meaningful evidence).

This is from a well known consensus paper:
I brought this up with the author of the blog post. He stood by his statements and I would tend to agree with him. I didn't ask for permission to quote his response, so I won't copy it.

Part of his response though is that he thinks the statement from the ASA might be being misinterpreted or wasn't worded optimally. The statement says "a relatively large p-value does not imply evidence in favor of the null hypothesis".

If 'in favor of' is taken to mean that the null hypothesis is more likely than any alternative hypothesis, then it's correct that a high p value can't tell you that on its own. (But neither does a low p value provide evidence that an alternative hypothesis is more likely than the null hypothesis on its own.)

But if 'in favor of' is taken to mean providing any amount of evidence that even slightly nudges how likely the null hypothesis is, even if from 1% to 2% confidence, then it's not correct.

One can imagine a ridiculous scenario if high p values did not provide any evidence in favor of the null. For example, two studies might get p values of .01 for a particular experiment, so one might take that as fairly strong evidence against the null. Then 100 other studies are run on the exact same experiment and the p values for the rest of these are totally scattered from 0 to 1 as one would expect from the null, with ~95% of the p values greater than .05.

If high p values do not add evidence that the null is true, then that would imply that we should disregard most of the subsequent 50 experiments as not adding any useful information, and should maintain exactly the same confidence as we had when we only knew the data from the first two studies (if not more confidence since a few of the subsequent 100 will have p<.05 by chance).
 
Last edited:
Back
Top Bottom