Submaximal 2-day cardiopulmonary exercise testing to assess exercise capacity and [PESE] in people with long COVID 2025 Thomas et al

Andy

Retired committee member
Full title: Submaximal 2-day cardiopulmonary exercise testing to assess exercise capacity and post-exertional symptom exacerbation in people with long COVID.

Abstract​

Long COVID has a complex pathology and a heterogeneous symptom profile that impacts quality of life and functional status. Post-exertional symptom exacerbation (PESE) affects one-third of people living with long COVID, but the physiological basis of impaired physical function remains poorly understood.

Sixty-eight people (age (mean ± SD): 50 ± 11 years, 46 females (68%)) were screened for severity of PESE and completed two submaximal cardiopulmonary exercise tests separated by 24 h. Work rate was stratified relative to functional status and was set at 10, 20 or 30 W, increasing by 5 W/min for a maximum of 12 min.

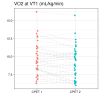
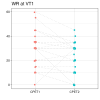
At the first ventilatory threshold (VT1), V̇O2 was 0.73 ± 0.16 L/min on Day 1 and decreased on Day 2 (0.68 ± 0.16 L/min; P = 0.003). Work rate at VT1 was lower on Day 2 (Day 1 vs. Day 2; 28 ± 13 vs. 24 ± 12 W; P = 0.004). Oxygen pulse on Day 1 at VT1 was 8.2 ± 2.2 mL/beat and was reduced on Day 2 (7.5 ± 1.8 mL/beat; P = 0.002). The partial pressure of end tidal carbon dioxide was reduced on Day 2 (Day 1 vs. Day 2; 38 ± 3.8 vs. 37 ± 3.2 mmHg; P = 0.010). Impaired V̇O2 is indicative of reduced transport and/or utilisation of oxygen. V̇O2 at VT1 was impaired on Day 2, highlighting worsened function in the 24 h after submaximal exercise. The data suggest multiple contributing physiological mechanisms across different systems and further research is needed to investigate these areas.

Highlights​

  • What is the central question of this study?

    Can a submaximal 2-day cardiopulmonary exercise test (CPET) protocol suggest why people living with long COVID experience post-exertional symptom exacerbation (PESE)?
  • What is the main finding and its importance?

    A submaximal 2-day CPET protocol revealed a reduction in oxygen uptake, oxygen pulse and partial pressure of end tidal carbon dioxide, suggesting dysfunctional oxygen transport, utilisation or both may contribute to long COVID PESE. Provided that there are appropriate and detailed screening processes that exclude people living with moderate–severe-risk post-exertional malaise, submaximal CPET offers a safe and informative option to investigate long COVID pathophysiology.

Open access
 
I'm puzzled by their use of the terms PESE and PEM to mean possibly different things.
I've seen this elsewhere online with people stating that PEM is unique to ME/CFS whereas PESE is a more general feature of other conditions.

However, scanning this paper, I'm not even sure that's what the authors are doing as they've not clearly stated that they are two different things, and in fact 'PESE/PEM' is used throughout the paper. It's all a bit confused.
 
Last edited:
The only included the healthier patients:
Exclusion criteria comprised the following: <18 years of age, admitted to or received treatment from intensive care units, unconfirmed COVID-19 test or no retrospective clinician diagnosis, no confirmed long COVID diagnosis from a healthcare professional, reporting a grade 0 or 1 on the Post-COVID-19 Functional Status (PCFS) scale, and reporting a 3 or 4 for symptom frequency and severity on the DePaul symptom screening questionnaire (Cotler et al., 2018).
They were supposed to use an app for tracking symptoms, but it didn’t really work for technical reasons:

2.4.2 Symptom app reporting​

A mobile device app developed by Sheffield Hallam University was used daily to report symptom severity and overall health a week prior to CPET Day 1, and for a week following CPET Day 2. Participants were asked to rate their overall health on a 0–100 scale (100 = best health, 0 = worst health), and the severity of several commonly associated long COVID symptoms such as fatigue, breathlessness, and difficulty thinking on a 0–100 scale (100 = high severity, 0 = symptom not present).

Symptom app data​

Nineteen participants provided responses via the mobile symptom app. Forty-nine participants did not use the symptom app due to technical issues and non-compliance with reporting symptoms. No adverse responses were reported or identified during the 7-day symptom-reporting and there were no differences in individual symptom severity between baseline and 7 days post-CPET Day 2. Overall health had decreased 7 days post-CPET Day 2 compared with baseline; however, this was non-significant when Bonferroni corrected (Day 1 vs. Day 2 [n = 19]; 46 ± 11% vs. 41 ± 16%; P = 0.027).
 
The raw data that they posted includes two datasets (separate sheets in Excel) but I don't see how these can be linked.

Both have 68 rows, so I assumed this were from the same participants and we could just bind the columns. But the sex columns from both sheets do not match suggesting that both sheets are in a different order?
You could probably join on multiple columns (e.g. where all of sex, age and BMI match.
 
I would to see paired values for individuals. My overall impression is that day 2 isn't that different from day 1 and it is likely that for about half the subjects it is the same - with the other half showing a more obvious difference.

I don't see how this in any way explains or reflects the terrible experience of PEM that members report. I also note that the heart rate on day 2 is lower - suggesting that adrenergic drive is less, for whatever reason.
 
You could probably join on multiple columns (e.g. where all of sex, age and BMI match.
Thanks for the suggestion. The best I got was 57 matches out of 68 using height, age and weight (sex has a lot of NA's in dataset 1 for some reason).

Some might be errors in data insertion. For example there's only 1 participant with height 175 cm and weight 74 kg in both datasets but in dataset1 the person has age 36, in dataset an age of 59.
 
Some might be errors in data insertion. For example there's only 1 participant with height 175 cm and weight 74 kg in both datasets but in dataset1 the person has age 36, in dataset an age of 59.
Oh that is weird. I tried as well using age and height. In dataset 1, there are two participants with age 68 (heights 165 and 167.2), while in dataset 2, there is only one participant with age 68, and they have height 165. There's a participant listed with height 167.2 but their age is 54.
 
In table 4 of the paper, they report an effect size for Work rate at the first ventilatory threshold of 0.742. I don't see how it can be that large. I got an estimate of cohen d = 0.44 when using the sd of the difference between CPETs and d = 0.34 when using the poolsed sd of CPET1.
 
In table 4 of the paper, they report an effect size for Work rate at the first ventilatory threshold of 0.742. I don't see how it can be that large. I got an estimate of cohen d = 0.44 when using the sd of the difference between CPETs and d = 0.34 when using the poolsed sd of CPET1.
They used this method described in the paper:
To calculate the effect size value of Wilcoxon's signed-rank t-tests, the formula Difference between sums of ranks/Total of sums of ranks was implemented with thresholds set at 0.1 = small, 0.3 = medium and 0.5 = large.
I didn't know what it meant, so I asked ChatGPT to write the Python to calculate this effect size, and using the provided code below I get 0.742.
Python:
import pandas as pd
import numpy as np
from scipy.stats import rankdata

# Sample DataFrame with paired data
data = pd.DataFrame({
    'pre': [10, 12, 14, 13, 11, 10, 13, 15, 16, 11],
    'post': [12, 11, 15, 14, 12, 9, 14, 14, 17, 12]
})

# Step 1: Calculate the difference
data['diff'] = data['post'] - data['pre']

# Step 2: Remove zero differences
data_nonzero = data[data['diff'] != 0].copy()

# Step 3: Rank the absolute differences
data_nonzero['abs_diff'] = data_nonzero['diff'].abs()
data_nonzero['rank'] = rankdata(data_nonzero['abs_diff'])

# Step 4: Assign signed ranks
data_nonzero['signed_rank'] = np.sign(data_nonzero['diff']) * data_nonzero['rank']

# Step 5: Calculate W+ and W-
w_pos = data_nonzero[data_nonzero['signed_rank'] > 0]['rank'].sum()
w_neg = data_nonzero[data_nonzero['signed_rank'] < 0]['rank'].sum()

# Step 6: Calculate Effect Size
effect_size = abs(w_pos - w_neg) / (w_pos + w_neg)

print(f"Wilcoxon Effect Size = {effect_size:.3f}")
 
They used this method described in the paper:

I didn't know what it meant, so I asked ChatGPT to write the Python to calculate this effect size, and using the provided code below I get 0.742.
Python:
import pandas as pd
import numpy as np
from scipy.stats import rankdata

# Sample DataFrame with paired data
data = pd.DataFrame({
    'pre': [10, 12, 14, 13, 11, 10, 13, 15, 16, 11],
    'post': [12, 11, 15, 14, 12, 9, 14, 14, 17, 12]
})

# Step 1: Calculate the difference
data['diff'] = data['post'] - data['pre']

# Step 2: Remove zero differences
data_nonzero = data[data['diff'] != 0].copy()

# Step 3: Rank the absolute differences
data_nonzero['abs_diff'] = data_nonzero['diff'].abs()
data_nonzero['rank'] = rankdata(data_nonzero['abs_diff'])

# Step 4: Assign signed ranks
data_nonzero['signed_rank'] = np.sign(data_nonzero['diff']) * data_nonzero['rank']

# Step 5: Calculate W+ and W-
w_pos = data_nonzero[data_nonzero['signed_rank'] > 0]['rank'].sum()
w_neg = data_nonzero[data_nonzero['signed_rank'] < 0]['rank'].sum()

# Step 6: Calculate Effect Size
effect_size = abs(w_pos - w_neg) / (w_pos + w_neg)

print(f"Wilcoxon Effect Size = {effect_size:.3f}")
Why does it remove the zero differences?
 
Why does it remove the zero differences?
I guess because the final equation is based on positive differences minus negative differences, so zero differences wouldn't have a place.

But in terms of the theory, my brain is too foggy to follow this right now, but these two webpages give some context:


Both appear to say that this test would not be suitable here because it's meant for continuous data (thus where there are few or no ties), but the CPET workrate data is grouped by intervals (10 watts, 15, 20, 25, ...), so there are many ties.

Edit: 20 out of 39 participants had no change in workrate, and thus were not factored into the effect size.
 
Last edited:
Both appear to say that this test would not be suitable here because it's meant for continuous data (thus where there are few or no ties), but the CPET workrate data is grouped by intervals (10 watts, 15, 20, 25, ...), so there are many ties.
Thank you. If stackexchange is correct, it appears like they might have used an inappropriate test.

This page also says that the statistical power of the test might decrease significantly if there are many ties:

Warning 2: zero values​

The second warning relates to pairs where the difference is 0. In the sleep data set, this is the case for the pair from the 5th patient (see above). Why are zeros a problem? Remember that the null hypothesis is that the differences of the pairs are centered around 0. However, observing differences where the value is exactly 0 do not give us any information for the rejection of the null. Therefore, these pairs are discarded when computing the test statistic. If this is the case for many of the pairs, the statistical power of the test would drop considerably. Again, this is not a problem for us as only a single zero value is present.
 
Back
Top Bottom