|
|
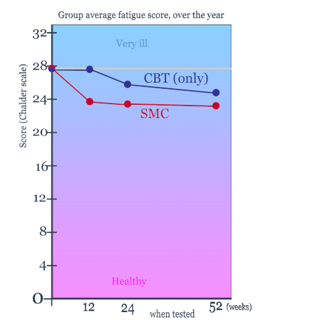
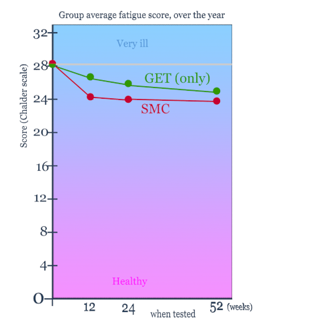
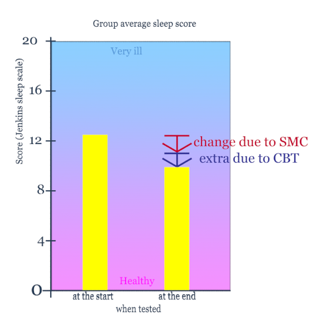
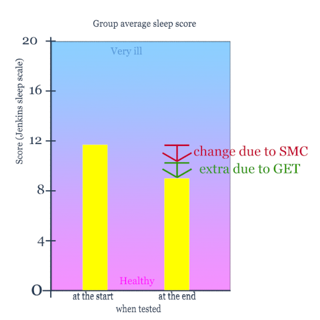
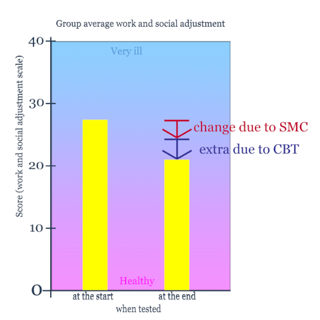
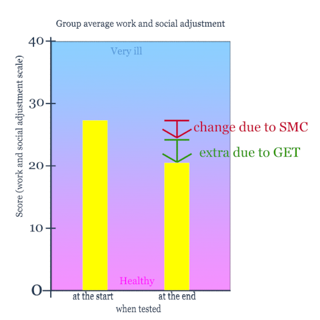
For this first set of 3 pairs of graphs an improvement is shown by a drop in the values. The line graphs plot the progress at 12, 24 and 52 weeks, whereas the bar graphs only show the original and final levels. The blue and green lines or arrows show the amount of improvement that CBT or GET has added to the improvement of the SMC group. The red shows the improvement by SMC alone.
|
|
|
|
|
Fatigue:- Cognitive Behaviour Therapy
|
|
Graded Exercise Therapy
|
|
|
|
|
|
|
|
|
|
|
|
Sleep:- Cognitive Behaviour Therapy
|
|
Graded Exercise Therapy
|
|
|
|
|
|
|
|
|
|
|
|
Work/Social:- Cognitive Behaviour Therapy
|
|
Graded Exercise Therapy
|
|
|
|
|
|
|
|
|
|
|
|
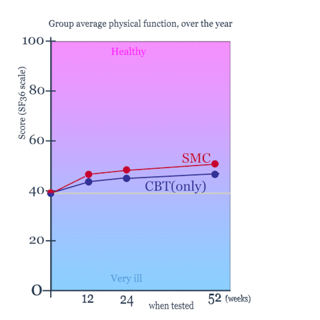
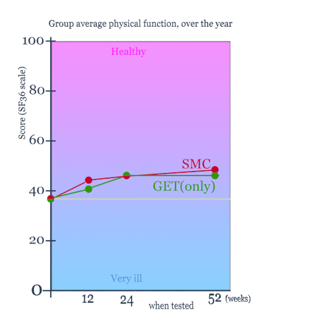
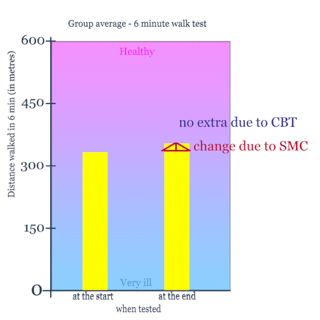
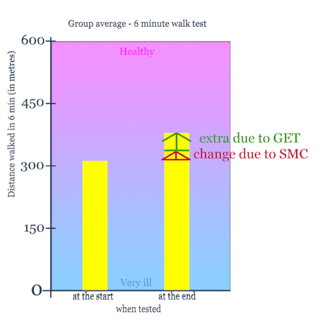
For the 2 pairs of graphs below an improvement is shown by an increase in the values. The line graphs plot the progress at 12, 24 and 52 weeks, whereas the bar graphs only show the original and final levels. Again, the blue and green lines show the additional improvement that CBT and GET recorded when compared with the SMC progress.
|
|
|
|
|
Physical:- Cognitive Behaviour Therapy
|
|
Graded Exercise Therapy
|
|
|
|
|
|
|
|
|
|
|
|
6 min walk:- Cognitive Behaviour Therapy
|
|
Graded Exercise Therapy
|
|
|
|
|
|
|
|
|
|
|
|
It must be remembered that for this test, in both groups, there were no assessments for approximately a quarter of the patients, so the reliability of these results is weak. There are several studies that have used the 6-minute walk test: from one published in Respiratory Medicine 2006 we are given the results for a group of healthy 20-50 year olds - 593 metres for women, and 630 metres for men (similar figures were obtained in a Chilean study). Combining these to reflect the proportion of 77% female patients in the PACE group gives us a healthy average (mean) walking distance of 601 metres (which is why we have drawn the vertical scale to 600) with a standard deviation of 54 metres. These measurements are likely to be normally distributed, so it is reasonable to set a boundary of 601–54=547 metres as a boundary for "normal health" (meaning 83% of healthy people, in this male/female ratio, would exceed 547 metres).
Click here for further comparisons, including other illnesses.
|
|
|
|
|
In most of these cases above, the group that did not receive any of the therapies (the SMC group) improved by over half of the amount that was seen in the groups that did receive the therapies. In other words, the therapies can only claim to account for a little under half the improvement, which is why the stated conclusion was that "CBT and GET can safely be added to SMC to moderately improve outcomes for chronic fatigue syndrome". How much of the other half of the improvement could be attributed to factors other than the specialist medical care (which was at a greater level than most patients experience) will be explored later.
|
|
|
|
|
summary more details (anim) further graphs further details chalder scale
summary more details (stills) further graphs further details chalder scale
|
|
|
|
|
pdf version
|
|
|
|

|